
SNOHOMISH COUNTY HOUSING MARKET FORECAST
Home Prices, Market Trends, Graphs Video and Infographics
SNOHOMISH COUNTY HOUSING MARKET AT A GLANCE
Click Image To View Full Size
TABLE OF CONTENTS
3 KEY INDICATORS
Snohomish County Housing Market
- SALES ACTIVITY INTENSITY:
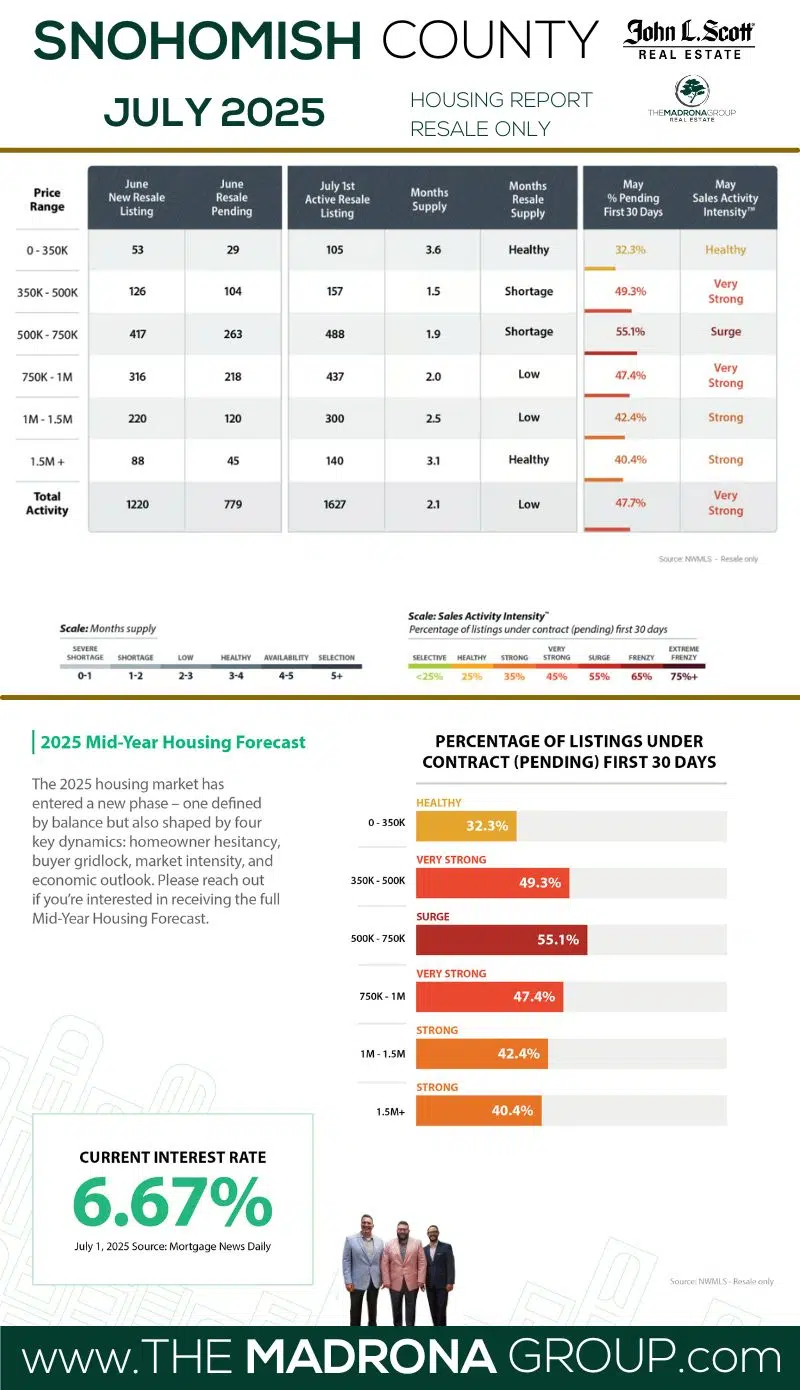
- 47.7% (VERY STRONG)
- INTEREST RATE:
- 6.67% (MANAGEABLE)
- INVENTORY LEVEL:
- 2.1 Months (LOW)
THE BIG DEAL
Affordability inches forward in Snohomish County. June marked the first time inventory topped 2 months in Snohomish County, giving buyers a bit more breathing room and leverage. With 1,469 new listings and a few more price reductions in play, the ultra-competitive edge is softening. But with the average resale price at $837K, affordability is still tight. It’s not a buyer’s market—but it’s no longer a sprint, and that alone is progress.More Listings, Strategic Moves, and Swift Sales in Snohomish County's Balanced Summer Market
Summer is here—but instead of a frenzy, Snohomish County is moving with purpose.
With 1,766 new listings hitting the market in June and inventory rising to 2.1 months, the market is finally loosening its grip. Technically, Sales Activity Intensity™ clocked in at 47.7%—landing us in “Surge” territory. But make no mistake: this isn’t a red-hot seller’s market. It’s a more thoughtful one.
Homes are still moving—especially well-priced properties in the $500K–$1M range—but the days of breakneck bidding wars and over-ask madness have cooled. Buyers are cautious, sellers are adjusting, and for the first time in a long time, both sides have a bit more room to negotiate.
This month’s report continues the shift we saw in May, providing a full look at resale trends, new construction movement, pricing shifts, and interest rate pressure.
To understand these shifts, we’re looking at the broader context of the 2025 Mid-Year Housing Forecast from John L. Scott CEO Lennox Scott, which outlines the four major dynamics shaping our market:
🏠 Homeowner Hesitancy
⛔ Buyer Gridlock
⚡ Market Intensity
📉 Economic Outlook
These trends are playing out across Snohomish County right now—and this update breaks down exactly how.
Detailed Explanation of the 3 Key Indicators
-
Sales Activity Intensity:
- Definition: This metric reflects the percentage of homes that go under contract within the first 30 days of listing. It's a direct indicator of the market's temperature, showing how quickly homes are moving from listing to pending status.
- Scale:
-
-
-
- <25%: Buyer's market – low demand, homes take longer to sell.
- 25%: Healthy market – balanced demand and supply.
- 35%: Strong market – increasing demand, sellers have a slight advantage.
- 45%: Very strong market – high demand, multiple offers are common.
- 55%: Surge – very high demand, significantly more buyers than available homes.
- 65%: Frenzy – extreme demand, homes sell extremely quickly, often well above asking price.
- 75%+: Extreme frenzy – unprecedented demand, highly competitive conditions.
-
Monthly Inventory Levels:
- Definition: This measures the number of months it would take to sell all current listings at the current sales pace without any new listings being added. It's a critical indicator of market balance.
- Scale:
- 0-1 month: Severe shortage – extremely low inventory, seller's market.
- 1-2 months: Shortage – low inventory, strong seller's advantage.
- 2-3 months: Low – less inventory, leaning towards sellers.
- 3-4 months: Healthy – balanced between buyers and sellers.
- 4-5 months: Selectability – more options for buyers, slight buyer's advantage.
- 5+ months: Buyer's market – high inventory, buyers have leverage.
-
Interest Rates:
- Definition: This refers to the average mortgage rate available to homebuyers. Interest rates are a significant factor affecting affordability and buyer demand.
- Scale (not a fixed scale but commonly accepted ranges):
- 3-4%: Excellent – very favorable for buyers.
- 5-6%: Good – relatively affordable for most buyers.
- 7-8%: Uncomfortable – can slow down buyer activity as financing becomes more expensive.
- 9-10%: Challenging – high rates can lead to decreased demand and slower market activity.
Sales Activity Intensity:
- Definition: This metric reflects the percentage of homes that go under contract within the first 30 days of listing. It's a direct indicator of the market's temperature, showing how quickly homes are moving from listing to pending status.
- Scale:
-
-
- <25%: Buyer's market – low demand, homes take longer to sell.
- 25%: Healthy market – balanced demand and supply.
- 35%: Strong market – increasing demand, sellers have a slight advantage.
- 45%: Very strong market – high demand, multiple offers are common.
- 55%: Surge – very high demand, significantly more buyers than available homes.
- 65%: Frenzy – extreme demand, homes sell extremely quickly, often well above asking price.
- 75%+: Extreme frenzy – unprecedented demand, highly competitive conditions.
-
Monthly Inventory Levels:
- Definition: This measures the number of months it would take to sell all current listings at the current sales pace without any new listings being added. It's a critical indicator of market balance.
- Scale:
- 0-1 month: Severe shortage – extremely low inventory, seller's market.
- 1-2 months: Shortage – low inventory, strong seller's advantage.
- 2-3 months: Low – less inventory, leaning towards sellers.
- 3-4 months: Healthy – balanced between buyers and sellers.
- 4-5 months: Selectability – more options for buyers, slight buyer's advantage.
- 5+ months: Buyer's market – high inventory, buyers have leverage.
Interest Rates:
- Definition: This refers to the average mortgage rate available to homebuyers. Interest rates are a significant factor affecting affordability and buyer demand.
- Scale (not a fixed scale but commonly accepted ranges):
- 3-4%: Excellent – very favorable for buyers.
- 5-6%: Good – relatively affordable for most buyers.
- 7-8%: Uncomfortable – can slow down buyer activity as financing becomes more expensive.
- 9-10%: Challenging – high rates can lead to decreased demand and slower market activity.
Each of these indicators plays a crucial role in interpreting the dynamics of the Seattle housing market. By analyzing trends within these metrics, we can better understand the forces at play, predict future movements, and strategize accordingly. Whether you're looking to buy a home, sell one, or simply keep an eye on market developments, these indicators provide the insights needed to navigate the complexities of Seattle's real estate landscape.
Sales Activity Intensity™
Snohomish County posted a 47.7% Sales Activity Intensity™ in June, down from May’s 50.1%, but still holding firm in “Very Strong” territory. While it technically qualifies as a “Surge,” the mood has clearly shifted from frenzy to focus. Homes are moving, but buyers are calculating—not sprinting.
- 🕒 Average Days on Market: 23
- 👀 Showings to Pending: 10
- 🎯 Hot Zone: $500K–$800K—still where most of the action lives
The right home, priced right and prepped right, still pulls in quick offers. But homes that are dated or reach too far on price? They’re sitting longer or getting overlooked.
📌 What This Means
For Buyers: Be decisive, not desperate. You don’t need to overbid, but you do need to move fast when a home checks your boxes.
For Sellers: The market still favors you—if you’re priced realistically and present your home like a pro.
Monthly Inventory Levels
Inventory in Snohomish County ticked up to 2.1 months—the highest level we’ve seen this year and the first time above 2 months since the pandemic surge. June saw 1,469 new listings, 974 homes pending, and 949 closings.
This gives buyers some breathing room—but not a full-on break. We’re still well under the 4–6 months needed for a truly balanced market.
📌 What This Means
For Buyers: You’ve got more time and options, but the best homes still move fast.
For Sellers: Inventory’s rising—get ahead of the late summer curve before you’re competing with more listings.
Interest Rates
Rates hovered at 6.67% in June—steady, slightly uncomfortable, but no longer a deal-breaker. Buyers have adapted with tools like buydowns, lender credits, and more flexible loan products.
📌 What This Means
For Buyers: Don’t let rates scare you off—there are ways to make the numbers work.
For Sellers: Offering a rate buydown can help you stand out without trimming your asking price.
Pricing Trends Over 5 Years
While the headlines often focus on month-over-month fluctuations, the long-term view tells the real story:
🏡 Residential Resale
- June 2025 Avg. Price: $837,291
- June 2020 Avg. Price: $583,978
- 5-Year Change: ⬆️ 43.3%
🧱 New Construction
- June 2025 Avg. Price: $939,744
- June 2020 Avg. Price: $1,055,499
- 5-Year Change: ⬇️ 11%
🏢 Condos
- June 2025 Avg. Price: $628,126
- June 2020 Avg. Price: $408,933
- 5-Year Change: ⬆️ 53.6%
📌 What This Means
For Buyers: This market has stabilized. You’re buying at the base of the new plateau—not the peak.
For Sellers: You’ve likely gained substantial equity—maximize it by listing smart and strategically.
Key Takeaways
For Sellers:
✔ List now before inventory builds further
✔ Price realistically—overpricing is punished fast
✔ Offer buyer perks to stay competitive without cutting your price
For Buyers:
✔ Get pre-approved and stay nimble
✔ Look for motivated sellers and builder incentives
✔ The $500K–$800K market is busy—expect competition
Rent vs. Buy in Snohomish County
- Avg. Rent for a 3-Bedroom: ~$3,100/month
- Mortgage on $500K home @ 6.67% (20% down): ~$3,100/month
📌 Bottom Line: If you're planning to stay more than 3 years, buying is the better financial move. Equity, stability, and long-term wealth > rent receipts.
The Fed’s Influence
No fireworks from the Fed just yet. Major rate cuts aren’t expected until late 2025, which means mortgage rates will likely hover in the 6–7% range for the foreseeable future.
📌 What This Means
For Buyers: Waiting for 5% rates? You might miss your window.
For Sellers: Use smart incentives to offset buyer hesitation on rates—without slashing your list price.
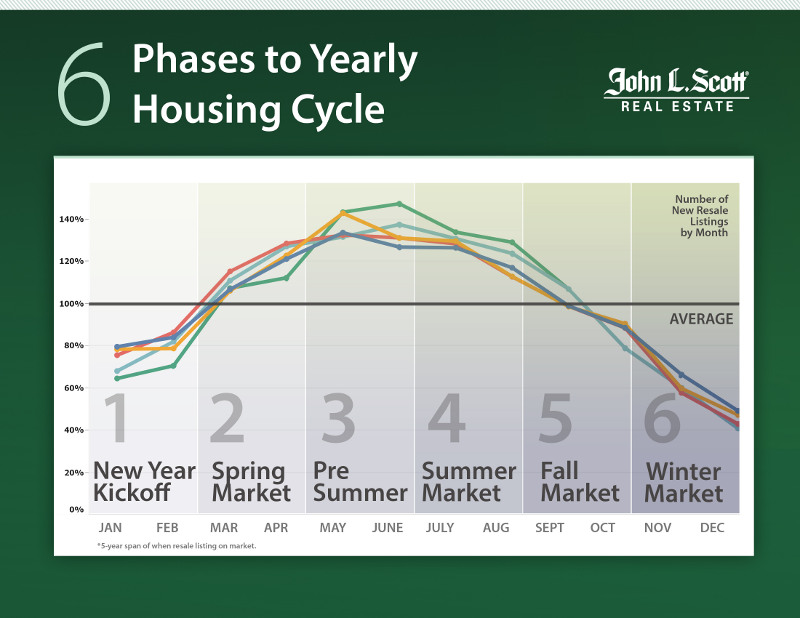
Seasonality
Spring has passed, and we’re now squarely in Seattle’s mid-summer housing rhythm—more listings, slower weekends, and buyers who are active, but no longer panicked.
- New Listings: 1,469
- Pending Sales: 974
- Inventory: Up to 2.1 months—giving buyers more choice, but not yet tilting the market
We're no longer in the chaotic pace of March and April. Instead, July brings a more thoughtful, opportunity-driven market—especially for buyers who stayed patient through the spring wave.
📌 What This Means
For Sellers:
✔ The market is still moving—but competition is climbing. Get listed now, before late-summer distractions and rising inventory slow momentum.
✔ Presentation and pricing are everything.
For Buyers:
✔ This is your season to make a smart, not rushed, decision.
✔ More listings mean more leverage—just don’t wait for a market shift that may not come.
A Return to BalanceAfter years of pandemic disruptions and interest rate lock-ins, the housing market is finally moving toward a healthier balance. May and June consistently bring the highest volume of new listings, and this year is no exception. Buyers are gaining options and negotiating power, while sellers are pricing more realistically and still seeing solid demand. This renewed equilibrium marks the most balanced conditions we’ve seen in over five years, creating a window of opportunity for both sides to make confident, well-timed moves.J Lennox Scott
LENNOX SCOTT
CEO of John L. Scott Real Estate

Snohomish County Real Estate GRAPHS & Data

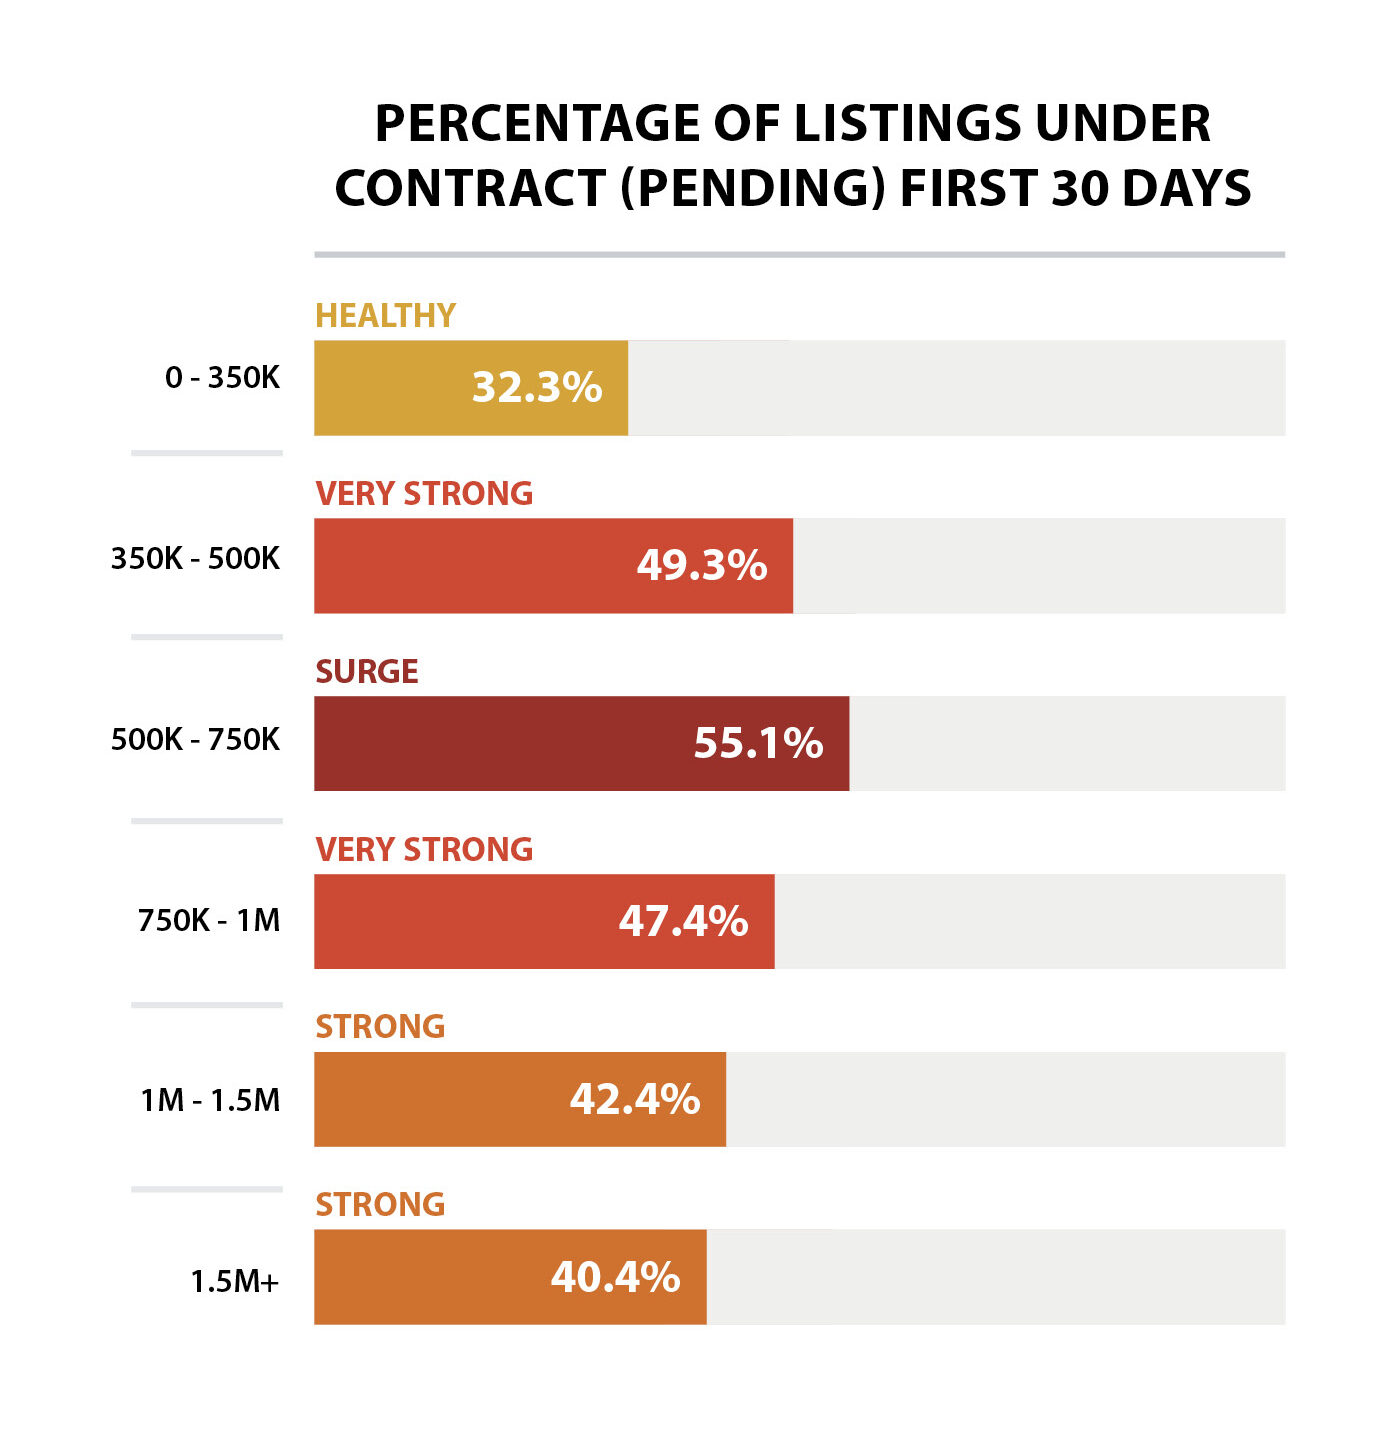
Snohomish County clocked in at 47.7% Sales Activity Intensity™ for June, slipping from May’s 50.1%. That means just under half of all homes are going pending in the first 30 days—a clear indicator we’re still in a Very Strong market, even as the pace cools slightly.
The $400K–$1M range continues to lead the charge, with many homes in that sweet spot going pending within a week. Above $1.5M? It’s still moving—if the home checks all the right boxes: turnkey condition, desirable location, and sharp pricing.
🔁 Market Dynamics:
- 🕒 Average Days on Market: 23
- ✅ 974 homes went pending
- 📦 Inventory: 2.1 months
- 👀 Showings to Pending: 10
- 💥 Buyer urgency remains strong, even at 6.67% interest rates
What we’re seeing now is efficiency over speed. Buyers are still stepping up—but they’re being choosier. Homes that are dialed in with condition and value are moving fast. The rest? Not so much.
📌 What This Means
For Buyers:
✔️ Don’t wait on the good ones. Nearly half of listings are gone in 30 days or less.
✔️ Come pre-approved and ready to write. Flexibility and strong terms win.
✔️ Expect competition—but also opportunity in overlooked listings.
For Sellers:
✔️ If you’re in the $400K–$1M range, you’re in the sweet spot.
✔️ Presentation and pricing are everything—buyers are discerning, not desperate.
✔️ Want weekend offers? List sharp and be ready.
PRICE
Home prices in Snohomish County continued their upward climb in June, with the average residential resale price reaching $837,291—up from $818,324 in May. Even as interest rates hover at 6.67%, buyers are showing up and making moves, especially in the highly competitive $500K–$800K range.
📊 By Property Type – June 2025
- 🏠 Single-Family Homes: $912,701
- 🏢 Condos: $628,126
📈 5-Year Appreciation Snapshot (June 2020 → June 2025)
- Overall Market: Up 43.3% (from $583,978 to $837,291)
- Single-Family Homes: Up 56.3%
- Condos: Up 53.6%
This isn’t just seasonal momentum—it’s decade-defining equity growth. In the face of rate hikes, economic shifts, and inflation, Snohomish County has delivered real returns for homeowners.
💵 Pricing Dynamics
- List-to-Sale Price Ratio: 99.8% — homes are closing just under asking
- Condos: Holding strong at 99.5%
- Sweet Spot: $500K–$800K homes continue to draw quick, competitive offers
- Overpriced or Dated Listings: Sitting longer and facing quiet buyer rejection
📌 Key Takeaways
For Sellers:
✔ You’ve gained serious equity—leverage it with smart strategy.
✔ Homes that shine (upgrades, layout, curb appeal) are still commanding top dollar.
✔ The market’s still moving—but it’s rewarding precision, not overconfidence.
For Buyers:
✔ Prices are still going up. Snohomish isn’t backing down—it’s building value.
✔ Buying now means locking in equity growth for the long haul, even with higher rates.
✔ The long-term upside still beats waiting and renting.
Spring has come and gone—welcome to the mid-summer market, where focus and follow-through separate the serious from the sideline-watchers.
Snohomish County is still moving at a healthy clip, but the mood has shifted from frenzy to finesse. More listings, more price adjustments, and slightly more breathing room are giving buyers and sellers alike a chance to think before they leap.
Here’s what June brought to the table:
- ✅ 974 homes went pending
- 🔑 949 homes closed
- 🕒 Average Days on Market: 23
- 📦 Inventory: Climbed to 2.1 months—still tight, but no longer claustrophobic
📌 What This Means
For Sellers:
✔ This is still your season to shine—but the window narrows from here.
✔ Hit the market now while buyer demand is steady and inventory hasn’t hit late-summer highs.
✔ Sharp pricing and polished presentation will help you rise above the growing crowd.
For Buyers:
✔ Inventory gains mean more options—but also more decisions to make.
✔ Homes in the $500K–$800K range are still going fast, especially in well-connected neighborhoods.
✔ Stay ready and move when it makes sense—this is the time for strategic offers, not bidding wars.
JOB AND POPULATION GROWTH
Washington State Non Farm Employment Numbers
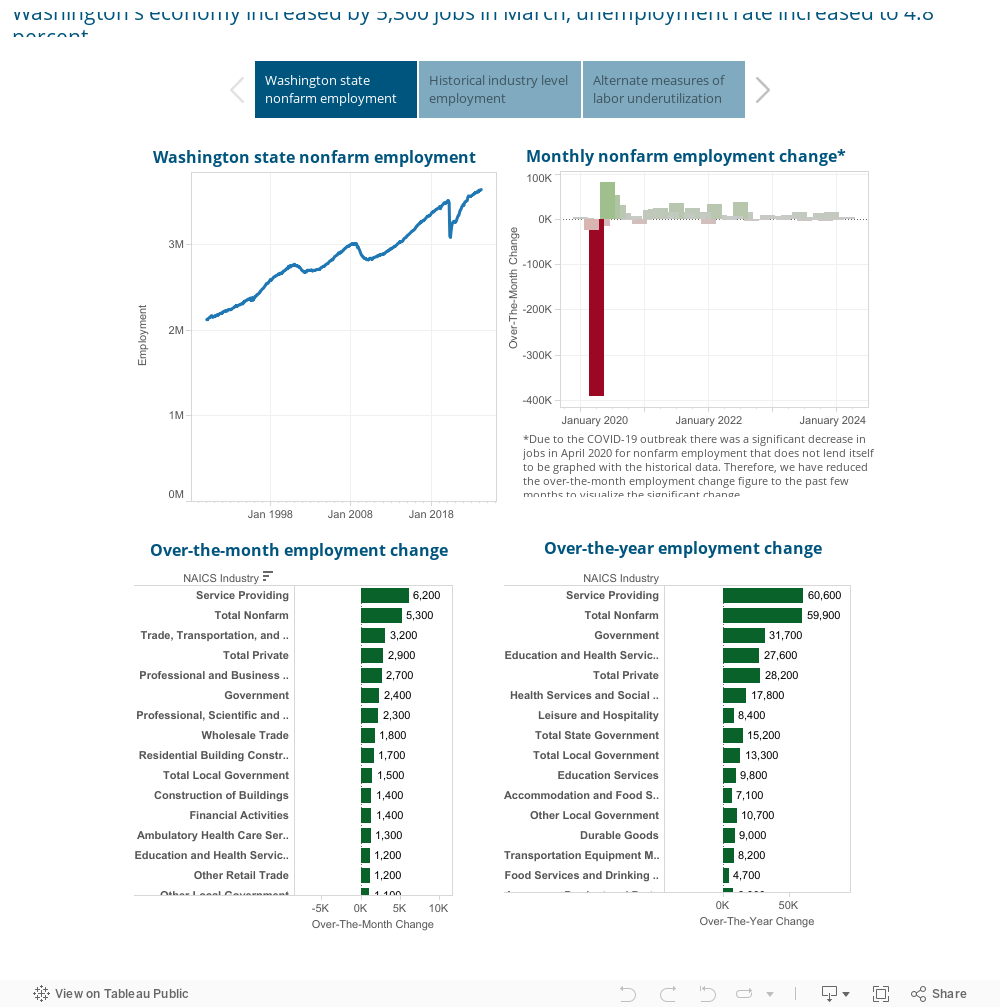
WA Employment Security Department
 [Source: U.S. Census Bureau]

Snohomish County Housing Market Stats
STATS PROVIDED BY: INFOSPARK
RESIDENTIAL RESALE
- $837,291 was the average sold price for listings in Snohomish County.
- 1,469 new listings went on the market this month.
- 2,315 homes were for sale during the month.
- 974 homes went pending in Snohomish County.
- 949 homes sold this month
- 2.1 months of inventory available in Snohomish County.
- 23 was the average days on market for a home to sell in Snohomish County.
- 99.8% was the average listing price vs. sales price percentage
- $434 was the average price per square foot in Snohomish County.
- $793,508,772 was the total closed sales volume for Snohomish County.
- 6.67% was the interest rate
- 47.7% of homes sold in the first 30 days in Snohomish County.
- 10 Average showings to go Pending
- 4.5 Showings per Listing
NEW CONTSRUCTION
- $939,744 was the average sold price for new construction in Snohomish County
- 147 new construction listings went on the market this month
- 347 new construction homes were for sale during the month
- 115 new construction homes went pending in Snohomish County
- 145 new construction homes sold this month
- 2.3 months of new construction inventory available in Snohomish County
- 35 was the average days on market for new construction to sell
- 99.5% was the average listing price vs. sales price percentage
- $417 was the average price per square foot in Snohomish County
- $136,262,900 was the total closed sales volume for Snohomish County
- 6.67% was the interest rate
- 7 Average showings to Pending
- 2.2 Showings per Listing
Snohomish County Housing Market Summary
Snohomish County hasn’t lost momentum—even as we shift deeper into summer. Buyer activity remains strong, inventory is rising but still tight, and homes are moving quickly—especially when they’re priced right and presented well.
Here’s what the data is telling us:
- ✅ 911 homes sold
- 🚀 1,071 homes went pending—buyers are still absorbing inventory faster than it hits the market
- 📦 Inventory rose to 2.1 months, still well under balanced
- ⏱ Average Days on Market: 23
- ⚡ Sales Activity Intensity™: 47.7%—still a Very Strong market by definition
Even with 1,469 new listings in June, competition remains sharp in key zones. Homes in the $500K–$800K range continue to sell fast—many with multiple offers. On the higher end, $1.5M+ homes are also moving, but only if they offer premium features and smart pricing.
🎯 Competitive Zones to Watch
- $500K–$800K: Still the most active slice of the market
- $1.5M+: Buyers are looking—but they expect excellence
💡 Pricing & Strategy
For Sellers:
✔ You still have the advantage—but buyers are savvy.
✔ Prep and price right from day one to avoid becoming stale.
✔ Market dynamics still support strong outcomes—but only for homes that shine.
For Buyers:
✔ More listings mean more choice—but also more competition.
✔ Be prepared to act quickly in hot zones, especially under $800K.
✔ Strategy and timing are everything right now.
🔭 Looking Ahead
As we move through summer:
- 📈 Listings will continue to rise
- 🧍♂️ More buyers will step in before potential fall rate hikes
- ⚔️ Competition will stay elevated in top-performing price bands
🔑 Final Takeaway
Snohomish County’s housing market is still moving fast—just with a little more strategy than spring. Whether you're buying or selling, this market favors those who are prepared, informed, and acting with purpose.
The opportunities are here. The window is open. And with the right plan, you can still make your next move a winning one.
Share this post!