
SNOHOMISH COUNTY HOUSING MARKET FORECAST
Home Prices, Market Trends, Graphs Video and Infographics
SNOHOMISH COUNTY HOUSING MARKET AT A GLANCE

Click Image To View Full Size
TABLE OF CONTENTS
3 KEY INDICATORS
Snohomish County Housing Market
- SALES ACTIVITY INTENSITY:
- 57.2% (SURGE)
- INTEREST RATE:
- 6.95% (MANAGEABLE)
- INVENTORY LEVEL:
- 1.6 Months (SHORTAGE)
THE BIG DEAL
The Snohomish County market isn’t just holding strong—it’s sprinting into summer with serious momentum. 1,766 new listings hit the market in June, and while we’re seeing a higher percentage of price reductions, the demand hasn’t let up. Inventory bumped up slightly to 1.6 months, but we’re still deep in “Shortage” territory. With 57.2% of homes going pending in the first 30 days, Snohomish is riding high in the “Surge” zone—buyers are showing up, offers are flying, and the best homes are moving fast. Even with interest rates steady at 6.95%, competition is alive and well. If you're thinking about making a move, this is the window—because once summer distractions kick in, the pace could shift.More Listings, Fierce Demand, and Homes Moving Fast in Snohomish County Surge Season
Summer is right around the corner, but Snohomish County’s housing market is already on full boil. With 1,766 new listings hitting in June and buyers staying active despite elevated borrowing costs, we’re watching classic spring-season dynamics play out: more homes hitting the market, but demand still running ahead of supply.
Inventory has ticked up to 1.6 months, but that’s still deep in “Shortage” territory. Meanwhile, the Sales Activity Intensity™ is holding firm at 57.2%, meaning over half of all homes are going pending within the first 30 days. And even with interest rates sitting at 6.95%, buyers haven’t backed down—they’re simply moving smarter.
This month’s report builds off May’s momentum and delivers a full snapshot of resale, new construction, and everything in between. Whether you’re prepping to list, looking to buy, or just tracking the trends, this is the market update you need to navigate Snohomish County’s summer surge.
Detailed Explanation of the 3 Key Indicators
-
Sales Activity Intensity:
- Definition: This metric reflects the percentage of homes that go under contract within the first 30 days of listing. It's a direct indicator of the market's temperature, showing how quickly homes are moving from listing to pending status.
- Scale:
-
-
-
- <25%: Buyer's market – low demand, homes take longer to sell.
- 25%: Healthy market – balanced demand and supply.
- 35%: Strong market – increasing demand, sellers have a slight advantage.
- 45%: Very strong market – high demand, multiple offers are common.
- 55%: Surge – very high demand, significantly more buyers than available homes.
- 65%: Frenzy – extreme demand, homes sell extremely quickly, often well above asking price.
- 75%+: Extreme frenzy – unprecedented demand, highly competitive conditions.
-
Monthly Inventory Levels:
- Definition: This measures the number of months it would take to sell all current listings at the current sales pace without any new listings being added. It's a critical indicator of market balance.
- Scale:
- 0-1 month: Severe shortage – extremely low inventory, seller's market.
- 1-2 months: Shortage – low inventory, strong seller's advantage.
- 2-3 months: Low – less inventory, leaning towards sellers.
- 3-4 months: Healthy – balanced between buyers and sellers.
- 4-5 months: Selectability – more options for buyers, slight buyer's advantage.
- 5+ months: Buyer's market – high inventory, buyers have leverage.
-
Interest Rates:
- Definition: This refers to the average mortgage rate available to homebuyers. Interest rates are a significant factor affecting affordability and buyer demand.
- Scale (not a fixed scale but commonly accepted ranges):
- 3-4%: Excellent – very favorable for buyers.
- 5-6%: Good – relatively affordable for most buyers.
- 7-8%: Uncomfortable – can slow down buyer activity as financing becomes more expensive.
- 9-10%: Challenging – high rates can lead to decreased demand and slower market activity.
Sales Activity Intensity:
- Definition: This metric reflects the percentage of homes that go under contract within the first 30 days of listing. It's a direct indicator of the market's temperature, showing how quickly homes are moving from listing to pending status.
- Scale:
-
-
- <25%: Buyer's market – low demand, homes take longer to sell.
- 25%: Healthy market – balanced demand and supply.
- 35%: Strong market – increasing demand, sellers have a slight advantage.
- 45%: Very strong market – high demand, multiple offers are common.
- 55%: Surge – very high demand, significantly more buyers than available homes.
- 65%: Frenzy – extreme demand, homes sell extremely quickly, often well above asking price.
- 75%+: Extreme frenzy – unprecedented demand, highly competitive conditions.
-
Monthly Inventory Levels:
- Definition: This measures the number of months it would take to sell all current listings at the current sales pace without any new listings being added. It's a critical indicator of market balance.
- Scale:
- 0-1 month: Severe shortage – extremely low inventory, seller's market.
- 1-2 months: Shortage – low inventory, strong seller's advantage.
- 2-3 months: Low – less inventory, leaning towards sellers.
- 3-4 months: Healthy – balanced between buyers and sellers.
- 4-5 months: Selectability – more options for buyers, slight buyer's advantage.
- 5+ months: Buyer's market – high inventory, buyers have leverage.
Interest Rates:
- Definition: This refers to the average mortgage rate available to homebuyers. Interest rates are a significant factor affecting affordability and buyer demand.
- Scale (not a fixed scale but commonly accepted ranges):
- 3-4%: Excellent – very favorable for buyers.
- 5-6%: Good – relatively affordable for most buyers.
- 7-8%: Uncomfortable – can slow down buyer activity as financing becomes more expensive.
- 9-10%: Challenging – high rates can lead to decreased demand and slower market activity.
Each of these indicators plays a crucial role in interpreting the dynamics of the Seattle housing market. By analyzing trends within these metrics, we can better understand the forces at play, predict future movements, and strategize accordingly. Whether you're looking to buy a home, sell one, or simply keep an eye on market developments, these indicators provide the insights needed to navigate the complexities of Seattle's real estate landscape.
⚡ Sales Activity Intensity™
Snohomish County stayed firmly in Surge Mode this June, with 57.2% of homes going pending in the first 30 days. That’s a small drop from May’s 62%, but still a clear sign that demand is red hot—buyers are showing up, pre-approved, and ready to compete.
🕒 Average Days on Market: 20
👀 Showings to Pending: 10
🎯 Hot Zone: $500K–$800K – Still the heart of the action
Buyers are circling move-in-ready homes like hawks. The right home in the right price range? It’s getting scooped up fast—often with multiple offers. On the flip side, homes that overreach on price or skimp on presentation? Crickets.
📌 What This Means
For Buyers: Get serious, get pre-approved, and be ready to strike. You don’t need to overpay—but you do need to move fast when the right home hits.
For Sellers: The energy’s still on your side, but buyers are more selective. Price to match the market and bring your A-game on presentation to maximize your outcome.
🏘️ Monthly Inventory Levels
Snohomish County’s inventory crept up to 1.6 months in June—up from 1.3 last month, but still far below the 4–6 months considered “balanced.” With 1,766 new listings, 1,071 pending sales, and 911 closings, we’re seeing plenty of movement, but the market remains tight.
Supply is trying to keep up, but demand isn’t letting go. For now, sellers continue to hold the upper hand—but buyers are getting a bit more time and leverage.
📌 What This Means
For Buyers: The window is opening slightly—more listings mean more chances. Just don’t assume you’ve got time to linger.
For Sellers: Low competition still works in your favor. List now, before the late-summer slowdown and rising inventory make standing out tougher.
💸 Interest Rates
Rates inched up to 6.95%, but the market hasn’t blinked. Buyers have adjusted to this new normal, and in many cases, they’re using rate buydowns and creative financing to keep their payments in check.
📌 What This Means
For Buyers: Don’t let the rate stop you—there are ways to soften the blow. Focus on the bigger picture: equity, stability, and long-term value.
For Sellers: Offering a rate buydown or closing cost help can attract more buyers and stronger offers—without slicing your asking price.
📈 Pricing vs. Historical Pricing
Snohomish County prices are holding steady, with a few surprises. Here's how things stack up:
🏡 Residential Resale
- June 2025 Avg. Price: $844,570
- June 2020 Avg. Price: $848,238
- Net Change: -0.4%
Resale prices are nearly flat over five years—not a loss, but not a gain either. It’s a reminder that while the market is strong now, it took a few detours along the way.
🧱 New Construction
- June 2025 Avg. Price: $964,511
- June 2020 Avg. Price: $1,055,499
- Net Change: -8.6%
Builders have gotten more competitive on price, which means buyers are scoring better deals and added incentives.
🏢 Condos
- June 2025 Avg. Price: $589,936
- June 2020 Avg. Price: $623,727
- Net Change: -5.4%
Condos are still a great entry point, but pricing has softened—creating a solid opportunity for first-time buyers.
📌 What This Means
For Buyers: You're buying into a market that’s corrected and stabilized. Now is a strong entry point for long-term growth.
For Sellers: You may not be at your pandemic peak, but with demand high and inventory low, you’re still in a strong position—especially if your home is dialed in.
✅ Key Takeaways
For Sellers:
✔ This is your moment—especially if you’re under $800K.
✔ Prep, price, and market right to attract top-tier buyers.
✔ Consider incentives to stand out without cutting your price.
For Buyers:
✔ Pre-approval is non-negotiable.
✔ The $500K–$800K range is competitive—come in strong and clean.
✔ Explore creative financing and builder incentives to maximize affordability.
🏠 Rent vs. Buy
- Avg. 3-Bedroom Rent in Snohomish County: $3,100/month
- Estimated Mortgage on $500K Home @ 6.95% (20% down): ~$3,100/month
📌 Bottom Line: If you're planning to stay put for 3+ years, buying is the smarter move. You’ll lock in your monthly cost, build equity, and hedge against future rent hikes. Even in a higher-rate environment, ownership continues to be a long-term wealth builder.
🏦 The Fed’s Influence
No fireworks from the Fed just yet. Major rate cuts aren’t expected until late 2025, which means we’re likely living in a 6–7% mortgage world for the foreseeable future.
📌 What This Means
For Buyers: Don’t play the waiting game. Rising home prices could erase any savings from future rate drops.
For Sellers: Financing incentives—like rate buydowns or closing cost help—are powerful tools. Use them to keep your home competitive and attractive without slashing your list price.
🌸 Seasonality: The Spring Surge is in Full Swing
We’re deep in the Spring Surge Phase, the most active and competitive time of year in the Snohomish housing cycle. That means:
- Listings are up
- Buyers are out in force
- And competition—especially under $800K—is fierce
With 1,766 new listings and 1,071 pendings, the market’s got heat, momentum, and urgency. Inventory may have climbed slightly, but the demand is keeping things tight.
📌 What This Means
For Sellers: This is your window. List now, while buyer energy is high and competition is still relatively low.
For Buyers: More homes are coming, but so are more offers. The early birds are landing homes—so stay prepared and move quickly.
A Return to BalanceAfter years of pandemic disruptions and interest rate lock-ins, the housing market is finally moving toward a healthier balance. May and June consistently bring the highest volume of new listings, and this year is no exception. Buyers are gaining options and negotiating power, while sellers are pricing more realistically and still seeing solid demand. This renewed equilibrium marks the most balanced conditions we’ve seen in over five years, creating a window of opportunity for both sides to make confident, well-timed moves.J Lennox Scott
LENNOX SCOTT
CEO of John L. Scott Real Estate

Snohomish County Real Estate GRAPHS & Data

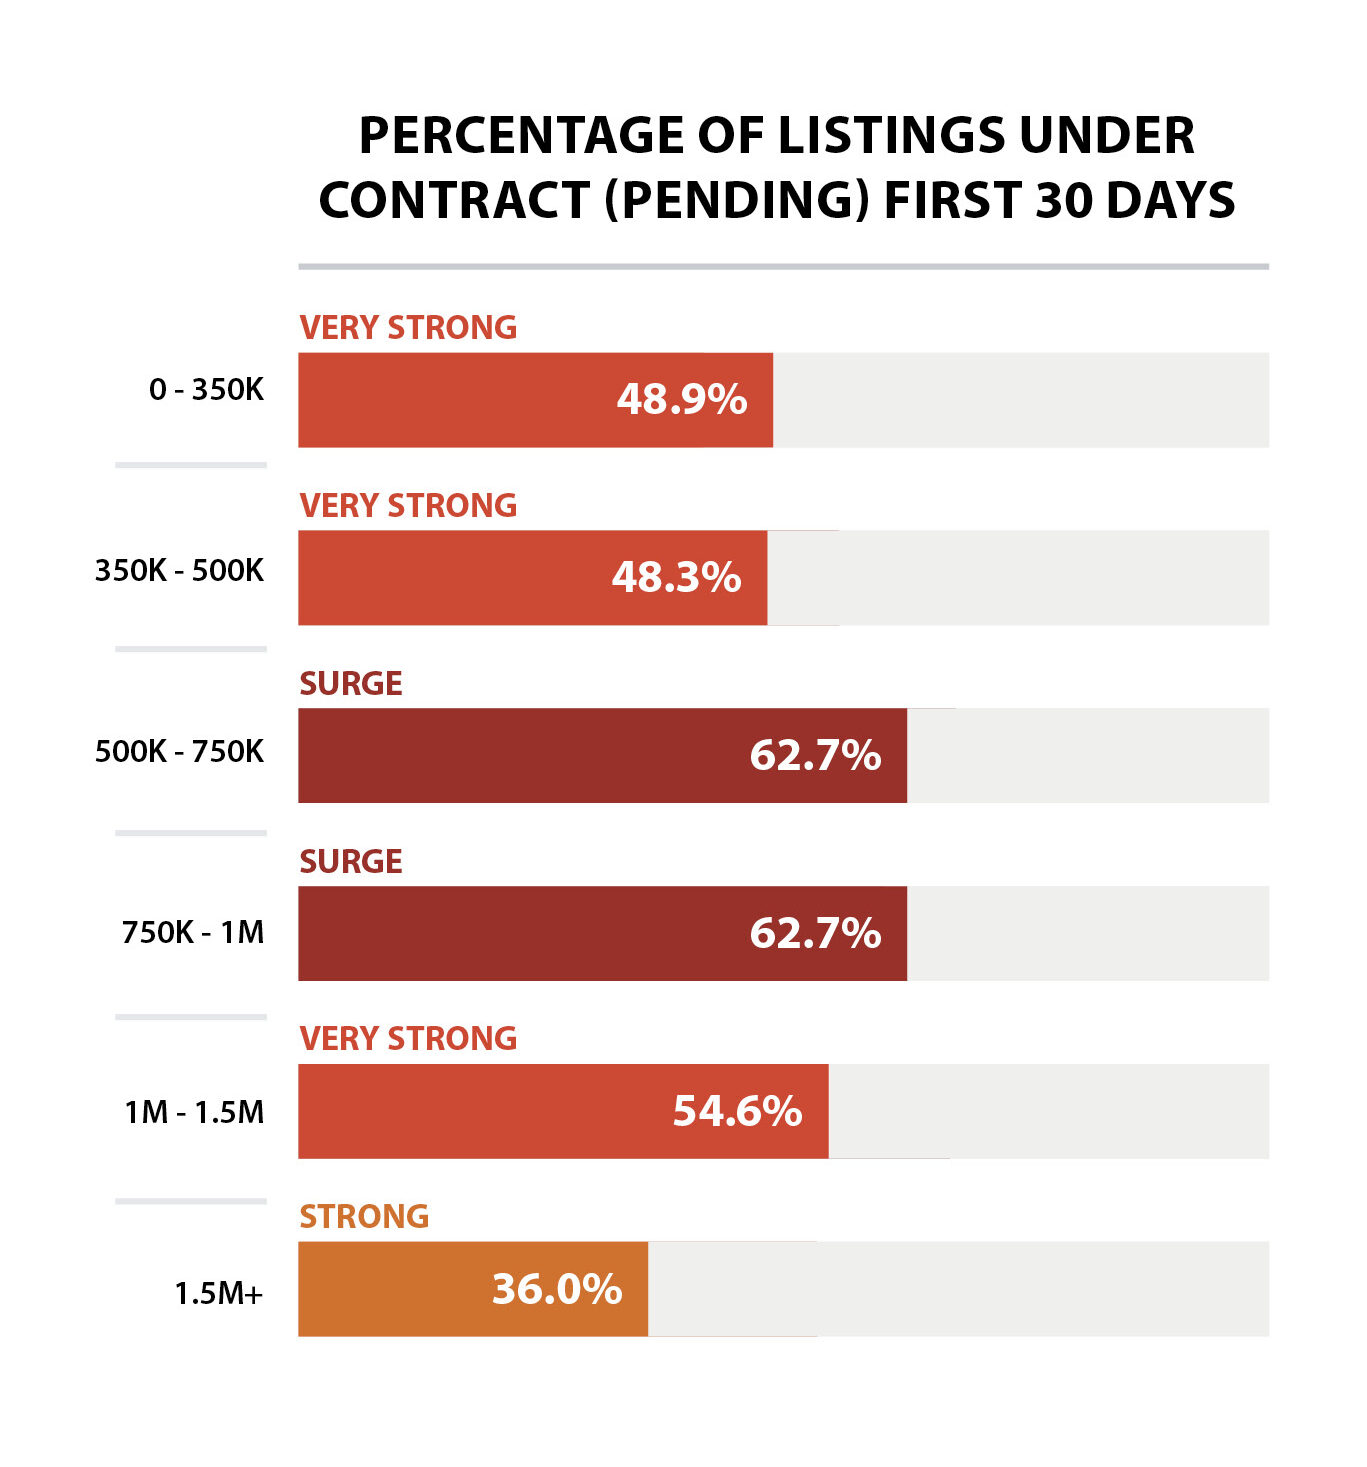
Snohomish County stayed in the Surge Zone for June 2025, with 57.2% of homes going pending within the first 30 days of hitting the market. That’s a small drop from May’s 62%, but it still places us firmly in a high-intensity market where well-priced, move-in-ready homes are flying off the shelf.
The $400K–$1M range continues to lead the charge, with many of these homes receiving multiple offers and going pending in a week or less. Even homes above $1.5M are finding buyers fast—provided they’re turnkey and in desirable locations.
🔁 Supporting this intensity:
🕒 Average Days on Market dropped to 20 days, down from 23 in May.
✅ 1,071 homes went pending in June.
📉 Inventory remains low at 1.6 months, keeping sellers in the driver’s seat.
Buyer urgency hasn’t faded, even with interest rates at 6.95%. Many are acting decisively, knowing that waiting could mean facing even higher prices—or more competition—as we head deeper into summer.
📌 What This Means
For Buyers:
✔ More than half the market is off the table in 30 days or less. If you see a home that checks your boxes, don’t wait for a second showing—it might be gone. Clean, compelling offers win in this environment.
For Sellers:
✔ The window is still open to capitalize on demand. Hit the market with strong pricing and flawless presentation. You’ll likely be looking at offers by the end of your first weekend if your home’s dialed in.
Bottom line? Snohomish County’s market is still surging. Buyer activity is intense, and the clock is ticking on every well-positioned listing.
PRICE
Home prices in Snohomish County are still on the rise, with June’s average sale price landing at $844,570—up from $818,324 in May. That’s a solid monthly gain in a market where interest rates continue to hover around 6.95%. Even with affordability stretched, buyers aren’t backing down—especially in that competitive $500K–$800K range.
📊 By Property Type – June 2025
- 🏠 Single-Family Homes: $894,117
- 🏢 Condos: $589,936
📈 5-Year Appreciation Snapshot (June 2020 to June 2025)
- Overall Market: Up 59.5% (from $529,673 to $844,570)
- Single-Family Homes: Up 60.5%
- Condos: Up 43.5%
That’s not just market strength—it’s long-term equity growth that’s beat inflation, wage growth, and most investment portfolios. Snohomish County has proven itself to be a powerhouse for homeowners.
💵 Pricing Dynamics
- List-to-Sale Price Ratio: 100.2% – homes are still selling at or just above list
- Condos: Holding steady at 99.9% of asking
- Sweet Spot: $500K–$800K homes are still seeing multiple offers and quick turnarounds
- Overpriced or dated listings? Still getting the silent treatment
📌 Key Takeaways
For Sellers:
✔ You've built serious value—don’t waste it. The right pricing, staging, and strategy could turn that equity into top-dollar results in record time.
✔ Homes with smart upgrades, curb appeal, and functional layouts are commanding strong attention.
For Buyers:
✔ The numbers don’t lie—prices are climbing, not falling. Locking in now means you’re buying into one of the strongest appreciation markets in the region.
✔ Even at 6.95%, the long-term payoff of ownership here still outweighs the rent-and-wait alternative.
Bottom line: Snohomish County prices are still climbing—steadily, competitively, and with long-term value on their side.
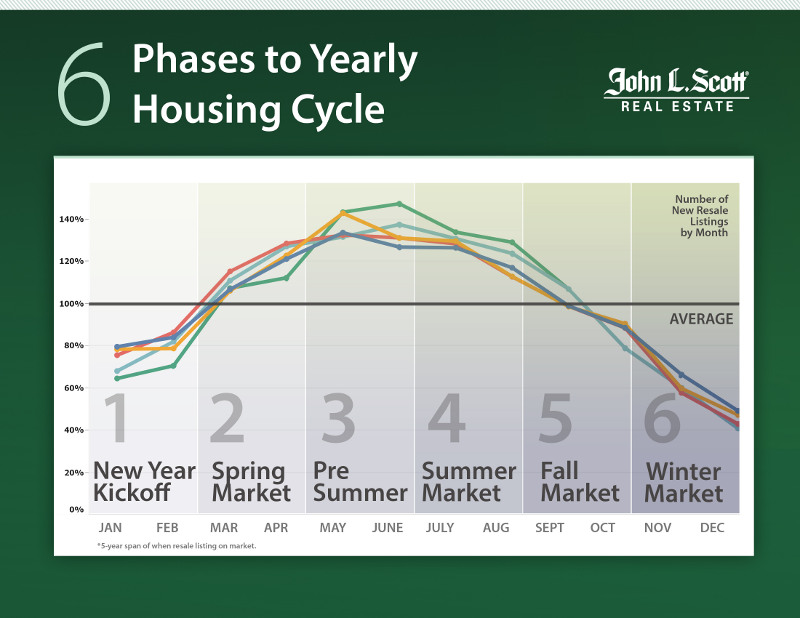
Snohomish County is firmly planted in the Spring Surge Phase, the most high-velocity period of the real estate year per the John L. Scott 6-Phase Housing Cycle. Listings are pouring in, buyers are highly active, and the market is moving fast—especially in that sub-$1M sweet spot.
Here’s what this season delivers:
🌷 New listings surging, as sellers race to hit peak buyer demand
🚪 Open houses are packed, with buyers showing up educated and ready to make moves
⚔️ Competition is fierce, particularly under $800K in top school districts and commute-friendly neighborhoods
And June’s data makes it crystal clear:
✅ 1,071 homes went pending
🔑 911 homes closed
📉 Average DOM dropped to 20 days
📦 Inventory ticked up to 1.6 months, but remains far from balanced
📌 What This Means
For Sellers:
✔ This is your window. Demand is high, inventory is tight, and buyers are acting fast. A well-presented home can still go pending in a weekend. Don’t wait for late summer when buyer activity starts to cool and inventory stacks up.
For Buyers:
✔ There’s more inventory—but also more competition. If you’re ready, act decisively. The $500K–$800K range is already seeing multiple offers and fast turnarounds. Early movers still have the edge before summer distractions shift the tempo.
In short: We’re in the heat of the Surge Phase—and this is when the most strategic moves are made. Whether you're buying or selling, now is the time to lean in.
JOB AND POPULATION GROWTH
Washington State Non Farm Employment Numbers
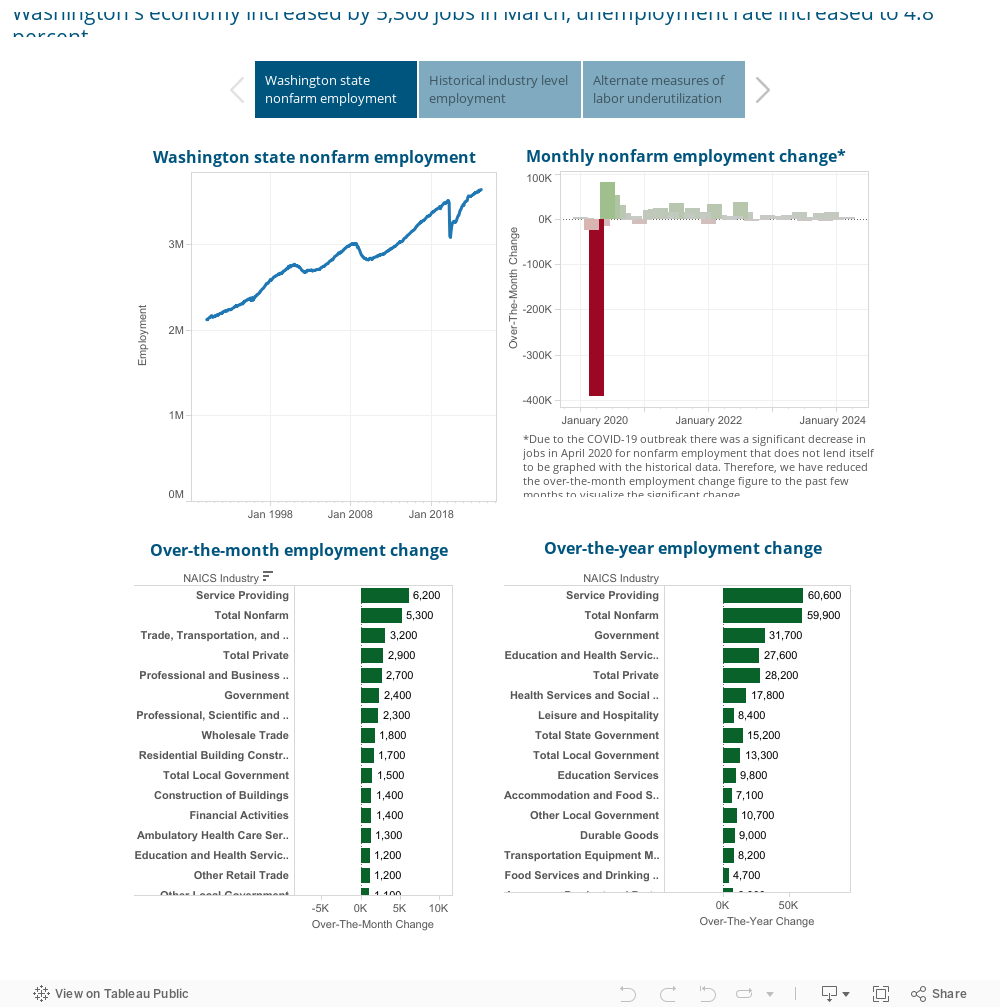
WA Employment Security Department
 [Source: U.S. Census Bureau]

Snohomish County Housing Market Stats
STATS PROVIDED BY: INFOSPARK
RESIDENTIAL RESALE
- $844,570 was the average sold price for listings in Snohomish County.
- 1,766 new listings went on the market this month.
- 2,093 homes were for sale during the month.
- 1,071 homes went pending in Snohomish County.
- 911 homes sold this month
- 1.6 months of inventory available in Snohomish County.
- 20 was the average days on market for a home to sell in Snohomish County.
- 100.2% was the average listing price vs. sales price percentage
- $432 was the average price per square foot in Snohomish County.
- $768,558,375 was the total closed sales volume for Snohomish County.
- 6.95% was the interest rate
- 57.2% of homes sold in the first 30 days in Snohomish County.
- 10 Average showings to go Pending
- 5 Showings per Listing
NEW CONTSRUCTION
- $964,511 was the average sold price for new construction in Snohomish County
- 203 new construction listings went on the market this month
- 335 new construction homes were for sale during the month
- 149 new construction homes went pending in Snohomish County
- 141 new construction homes sold this month
- 2.2 months of new construction inventory available in Snohomish County
- 34 was the average days on market for new construction to sell
- 99.9% was the average listing price vs. sales price percentage
- $419 was the average price per square foot in Snohomish County
- $135,996,108 was the total closed sales volume for Snohomish County
- 6.95% was the interest rate
- 6 Average showings to Pending
- 2.1 Showings per Listing
Snohomish County Housing Market Summary
Snohomish County’s housing market hasn’t lost a step heading into June. Buyer demand remains intense, inventory is still low, and the pace is fast—putting sellers in a strong position and keeping the competition tight, even as rates hover near 6.95%.
Here’s what the numbers are saying:
✅ 911 homes sold
🚀 1,071 homes went pending — buyers are still absorbing inventory faster than it’s hitting the market
📦 Inventory rose slightly to 1.6 months, but remains well below balanced
⏱ Average Days on Market: 20
⚡ Sales Activity Intensity™: 57.2% — over half of homes are under contract within the first 30 days
Even with 1,766 new listings in June, the market hasn’t loosened much. Well-prepped homes in the $500K–$800K range are still flying—often over asking and with multiple offers. And in the higher-end segment ($1.5M+), homes that offer turnkey finishes, desirable locations, and strong school access are commanding serious buyer interest.
🎯 Competitive Zones
- $500K–$800K is still where the action is heaviest—homes in this range are moving quickly and often drawing multiple bids.
- Over $1.5M? The demand is there—but only if the home checks the right boxes.
💡 Pricing & Strategy
Sellers: You still hold the upper hand, but buyers are getting pickier. Overpricing or skipping prep is a fast track to a stale listing.
Buyers: You’ve got more homes to pick from than earlier this year, but you still need to be ready to compete—especially in the most active price bands.
🔭 Looking Ahead
As we roll into summer:
📈 Expect a continued rise in listings
🧍♂️ More buyers will jump in before rates climb again
⚔️ Competition will stay elevated in key zones
Long-term appreciation remains strong, and Snohomish County continues to outperform both regionally and nationally when it comes to real estate investment.
🔑 Final Takeaway
This is still a now market. Whether you’re buying or selling, acting early—with a sharp strategy and expert guidance—is the best way to succeed. The window is open, the opportunities are real, and this market is still moving fast.
Share this post!