
SEATTLE HOUSING MARKET FORECAST
Home Prices, Interest Rates, Real Estate Statistics, Video and Charts
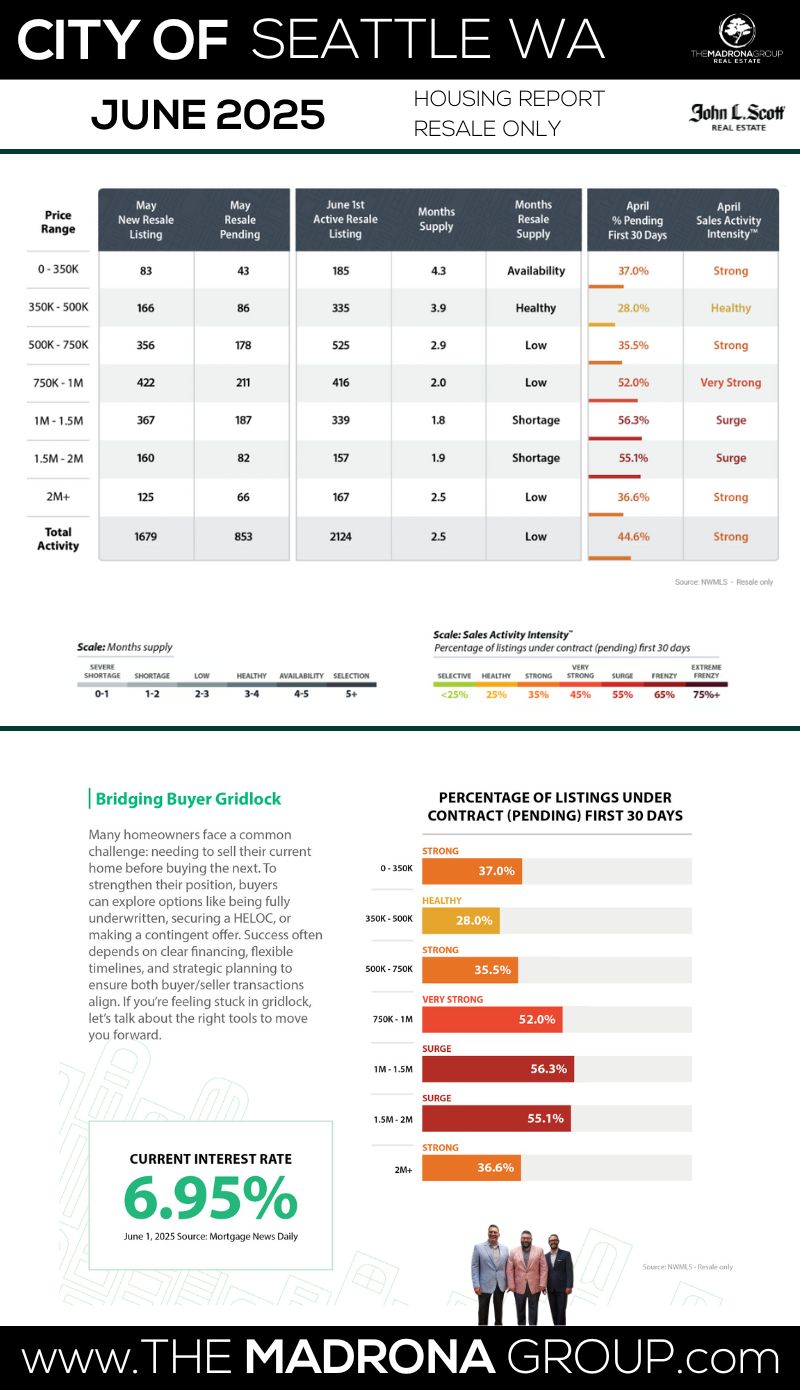
TABLE OF CONTENTS
3 KEY INDICATORS
Seattle Housing Market
- SALES ACTIVITY INTENSITY:
- 44.6% (STRONG)
- INTEREST RATE:
- 6.95% (MANAGEABLE)
- INVENTORY LEVEL:
- 2.5 Months (LOW)
THE BIG DEAL
Seattle just dropped 2,006 new listings in June—our biggest listing month of the year—and with it came a healthy dose of price reductions. Translation: sellers are getting realistic, and buyers are getting options. Inventory has climbed to 2.5 months, the highest we’ve seen in a while, signaling a shift toward a more balanced market. It’s not a buyer’s paradise just yet, but the days of 20-offer bidding wars and over-asking blowouts are cooling. With more homes to choose from and wiggle room on pricing, buyers finally have a seat at the table—just don’t expect a full buffet.Spring Brings More Listings, Price Cuts, and a Bit of Breathing Room in Seattle
June has arrived, and Seattle’s housing market is finally showing signs of balance—or at least a decent attempt at it. After a frenzied spring sprint, buyers are getting a little more breathing room thanks to 2,006 new listings and a bump in inventory to 2.5 months. It’s still a seller-leaning market, but the grip is loosening just enough to let buyers actually think before they write an offer.
Sales Activity Intensity dipped to 44.6%, sliding out of “Very Strong” and settling into a slightly more manageable pace. That means homes are still moving—but not in the blink-and-it’s-gone frenzy we saw just months ago. Meanwhile, mortgage rates hover around 6.95%. Not thrilling, not terrifying—just consistent. And in real estate? Consistency is underrated.
This month’s update picks up where we left off in May, keeping The Madrona Group’s format intact while delivering fresh, no-fluff insight. Whether you’re thinking about jumping into the market or just want to keep tabs on your neighborhood’s value, we’ve got the goods.
Detailed Explanation of the 3 Key Indicators
-
Sales Activity Intensity:
- Definition: This metric reflects the percentage of homes that go under contract within the first 30 days of listing. It's a direct indicator of the market's temperature, showing how quickly homes are moving from listing to pending status.
- Scale:
-
-
-
- <25%: Buyer's market – low demand, homes take longer to sell.
- 25%: Healthy market – balanced demand and supply.
- 35%: Strong market – increasing demand, sellers have a slight advantage.
- 45%: Very strong market – high demand, multiple offers are common.
- 55%: Surge – very high demand, significantly more buyers than available homes.
- 65%: Frenzy – extreme demand, homes sell extremely quickly, often well above asking price.
- 75%+: Extreme frenzy – unprecedented demand, highly competitive conditions.
-
-
-
Monthly Inventory Levels:
- Definition: This measures the number of months it would take to sell all current listings at the current sales pace without any new listings being added. It's a critical indicator of market balance.
- Scale:
- 0-1 month: Severe shortage – extremely low inventory, seller's market.
- 1-2 months: Shortage – low inventory, strong seller's advantage.
- 2-3 months: Low – less inventory, leaning towards sellers.
- 3-4 months: Healthy – balanced between buyers and sellers.
- 4-5 months: Selectability – more options for buyers, slight buyer's advantage.
- 5+ months: Buyer's market – high inventory, buyers have leverage.
-
Interest Rates:
- Definition: This refers to the average mortgage rate available to homebuyers. Interest rates are a significant factor affecting affordability and buyer demand.
- Scale (not a fixed scale but commonly accepted ranges):
- 3-4%: Excellent – very favorable for buyers.
- 5-6%: Good – relatively affordable for most buyers.
- 7-8%: Uncomfortable – can slow down buyer activity as financing becomes more expensive.
- 9-10%: Challenging – high rates can lead to decreased demand and slower market activity.
Each of these indicators plays a crucial role in interpreting the dynamics of the Seattle housing market. By analyzing trends within these metrics, we can better understand the forces at play, predict future movements, and strategize accordingly. Whether you're looking to buy a home, sell one, or simply keep an eye on market developments, these indicators provide the insights needed to navigate the complexities of Seattle's real estate landscape.
Sales Activity Indicator: Still Competitive, But Cooling From Spring's Sprint
Seattle’s market might not be sprinting anymore, but it's still in pretty decent running shape. In June, 44.6% of resale homes went pending within the first 30 days—a step back from May’s 50.1%, but still comfortably in “Very Strong” territory. The market's pulse is still there—it’s just not racing like it was in April.
With 2,006 new listings hitting the Seattle market this month, buyers finally have options—glorious, negotiable, maybe-even-priced-below-peak options. More homes means less pressure to pounce in 24 hours, and it shows: homes are averaging 25 days on market, and it now takes around 12 showings to get to pending, down from 14 last month. So yes, things have chilled… slightly.
But let’s not pretend it’s sleepy out there. Homes are still selling at 100.9% of list price, which means competition is alive and well for properties that show up looking sharp and priced right.
📌 What This Means
For Buyers: The days of instant regret after missing “the one” may be fading, but the best homes still move fast. Line up that pre-approval and act when it feels right.
For Sellers: The game has changed. You can still win big—but only if you prep, price, and present like a pro. This isn’t an “overprice and pray” season anymore.
Monthly Inventory Levels: Buyers Get a Breather, But It’s Still Tight
Seattle’s housing supply made its biggest jump in months—2.5 months of inventory, up from 2.1 last month. That’s the most breathing room buyers have had since pre-pandemic, and it’s making a noticeable impact.
June brought more than just warmer temps—2,917 homes were actively for sale, and that inventory bump is giving buyers just enough slack to think before they leap. Still, with a “balanced” market not kicking in until 4–6 months of inventory, we’re far from flipping the script.
Homes that are dialed in with pricing and presentation? Still flying. Listings that miss the mark? Starting to sit. The market’s no longer rewarding “aspirational” pricing.
📌 What This Means
For Buyers: You’ve got a little more time to breathe, but don’t get too comfortable—especially under $1M. Homes that check the boxes still draw a crowd.
For Sellers: The time to sell is still now, but the bar is higher. Stage it. Price it. Market it. A well-executed listing will still sell fast—and likely with strong terms.
Interest Rates: 6.95% – High, But Holding the Line
If mortgage rates were a song, they’d be “Steady as She Goes.” June’s average came in at 6.95%, which technically counts as stable these days. It’s not dreamy, but after the chaos of 2022–23, buyers are adjusting to this new normal with surprising ease.
There’s no rate shock, no panic—just recalibration. Buyers are getting creative with rate buydowns and flexible financing. And sellers? They’re stepping up with concessions to keep deals alive without cutting price.
📌 What This Means
For Buyers: You may not love the rate, but you can work with it. A good lender and a smart agent can help tailor a monthly payment that fits.
For Sellers: Want attention? Offer a rate buydown. It’s cheaper than a price drop and way more enticing.
Overall Market Trends: More Listings, More Choices, Still a Seller’s Edge
Seattle’s market is doing something it hasn’t done in years—acting kind of normal. Listings are up, price reductions are back, and buyers are finally catching their breath. But don’t get it twisted—well-priced homes are still selling fast, and for sellers who play their cards right, this is still a strong market.
Average resale home: $1,027,969
Average time to sell: 25 days
Sales-to-list price: 100.9%
📌 Key Takeaways
For Sellers:
✔ The window is still wide open—more listings are coming, so beat the late-summer crowd
✔ Prep is everything—don’t skip staging, marketing, or pricing strategy
✔ Offer smart incentives instead of price cuts
For Buyers:
✔ Be ready to act—but know you’ve got options now
✔ Clean, compelling offers still win
✔ Use rate tools to your advantage—ask your agent how
Pricing vs. Historical Pricing: A Market That’s Still Holding Its Ground
While some buyers are hoping for a discount season, the numbers tell a different story—Seattle home prices are holding strong, even after five years of market twists, turns, and rate rollercoasters.
Let’s break it down:
🏡 Residential Resale
- June 2025 Avg. Sale Price: $1,027,969
- June 2020 Avg. Sale Price: $1,059,099
- Net Change: -2.9% over 5 years
Resale prices have dipped slightly from the 2020 peak, but considering the interest rate spikes and pandemic-fueled volatility, this market has shown remarkable resilience. It’s more of a plateau than a plunge.
🧱 New Construction
- June 2025 Avg. Sale Price: $965,522
- June 2020 Avg. Sale Price: $1,033,816
- Net Change: -6.6%
New builds have seen the sharpest pullback in pricing, as builders adjust to buyer sensitivity around monthly payments. But in return? Buyers are scoring better deals and incentives than we've seen in years.
🏢 Condos
- June 2025 Avg. Sale Price: $683,180
- June 2020 Avg. Sale Price: $664,227
- Net Change: +2.8%
Condos have not only held their value—they’ve gained some ground. As more buyers get priced out of detached homes, the urban condo scene is quietly gaining momentum again.
Rent vs. Buy – The Great Debate
Average 3-bed rent in Seattle: $3,825/month
Monthly mortgage on a $700K home (20% down @ 6.95%): Roughly the same.
📌 If you're staying put for 3+ years? Buying is still your better bet. You’re building equity and locking in a fixed payment—not handing your future to your landlord.
What About The Fed?
Still no big drops expected until late 2025. The Fed’s got its eyes on inflation, which means we’re likely floating in the 6.5–7% mortgage range for a while.
📌 Don’t hold your breath for 5% rates. By then, home prices might be up another 10%.
Seasonality Check-In: The Spring Surge Is Fading... Slightly
June is prime time—buyers are active, inventory’s up, and serious deals are getting done. But come July? Expect the heat to turn literal and market momentum to chill a bit as summer distractions set in.
📌 Sellers: List now, not later. You’re in the sweet spot.
📌 Buyers: Don’t snooze on this season. Waiting could mean facing higher prices—or more competition come fall.
A Return to BalanceAfter years of pandemic disruptions and interest rate lock-ins, the housing market is finally moving toward a healthier balance. May and June consistently bring the highest volume of new listings, and this year is no exception. Buyers are gaining options and negotiating power, while sellers are pricing more realistically and still seeing solid demand. This renewed equilibrium marks the most balanced conditions we’ve seen in over five years, creating a window of opportunity for both sides to make confident, well-timed moves. J Lennox Scott
LENNOX SCOTT
CEO of John L. Scott Real Estate

Seattle Real Estate GRAPHS AND Data

Seattle’s inventory climbed again in June, now sitting at 2.5 months—up from 2.1 in May and nearly a full month higher than the ultra-tight levels we saw earlier this spring. It’s a shift toward balance, but make no mistake: we’re still living in a seller-skewed market. If no new listings came online, Seattle would burn through its entire housing stock in just about 75 days.
Let’s break down what the numbers are telling us:
- 2,006 new listings hit the market
- 970 homes went pending
- 834 homes sold
- 2,917 total homes for sale
That’s a solid surge in inventory—and it’s giving buyers a little more breathing room. But even with more homes to choose from, the right properties (especially in the $500K–$1.25M zone) are still drawing crowds. Nearly 45% of homes are going pending in the first 30 days—a dip from May’s 50%, but still holding strong in “Very Strong” Sales Activity territory.
🏡 Luxury Lane Update
In the $2M+ market, it’s a slower dance—but one with serious buyers still stepping onto the floor. These high-end deals are all about polish: homes with sleek design, premium finishes, outdoor space, and walkable locations are winning. Want to play in this tier? Think turn-key, not fixer-upper.
📉 Why Inventory Still Matters
- Inventory <3–4 months? That’s still a low-supply market
- Low supply + steady demand? Yep—upward price pressure remains
Even with rates around 6.95%, buyers haven’t backed off. The Seattle market is running on confidence and strategy—homes that are dialed in are still moving fast.
📌 Key Takeaways
For Buyers:
✔️ More choices, but don’t snooze—clean, well-located listings are still hot
✔️ Have your pre-approval ready, and don’t be afraid to get creative with terms
For Sellers:
✔️ The clock is ticking—more listings mean more competition is coming
✔️ If you're under $1.5M, you're in the fast lane—just don’t overprice
✔️ Over $2M? Presentation is everything. Luxe buyers expect luxe details.
MARKET INTENSITY
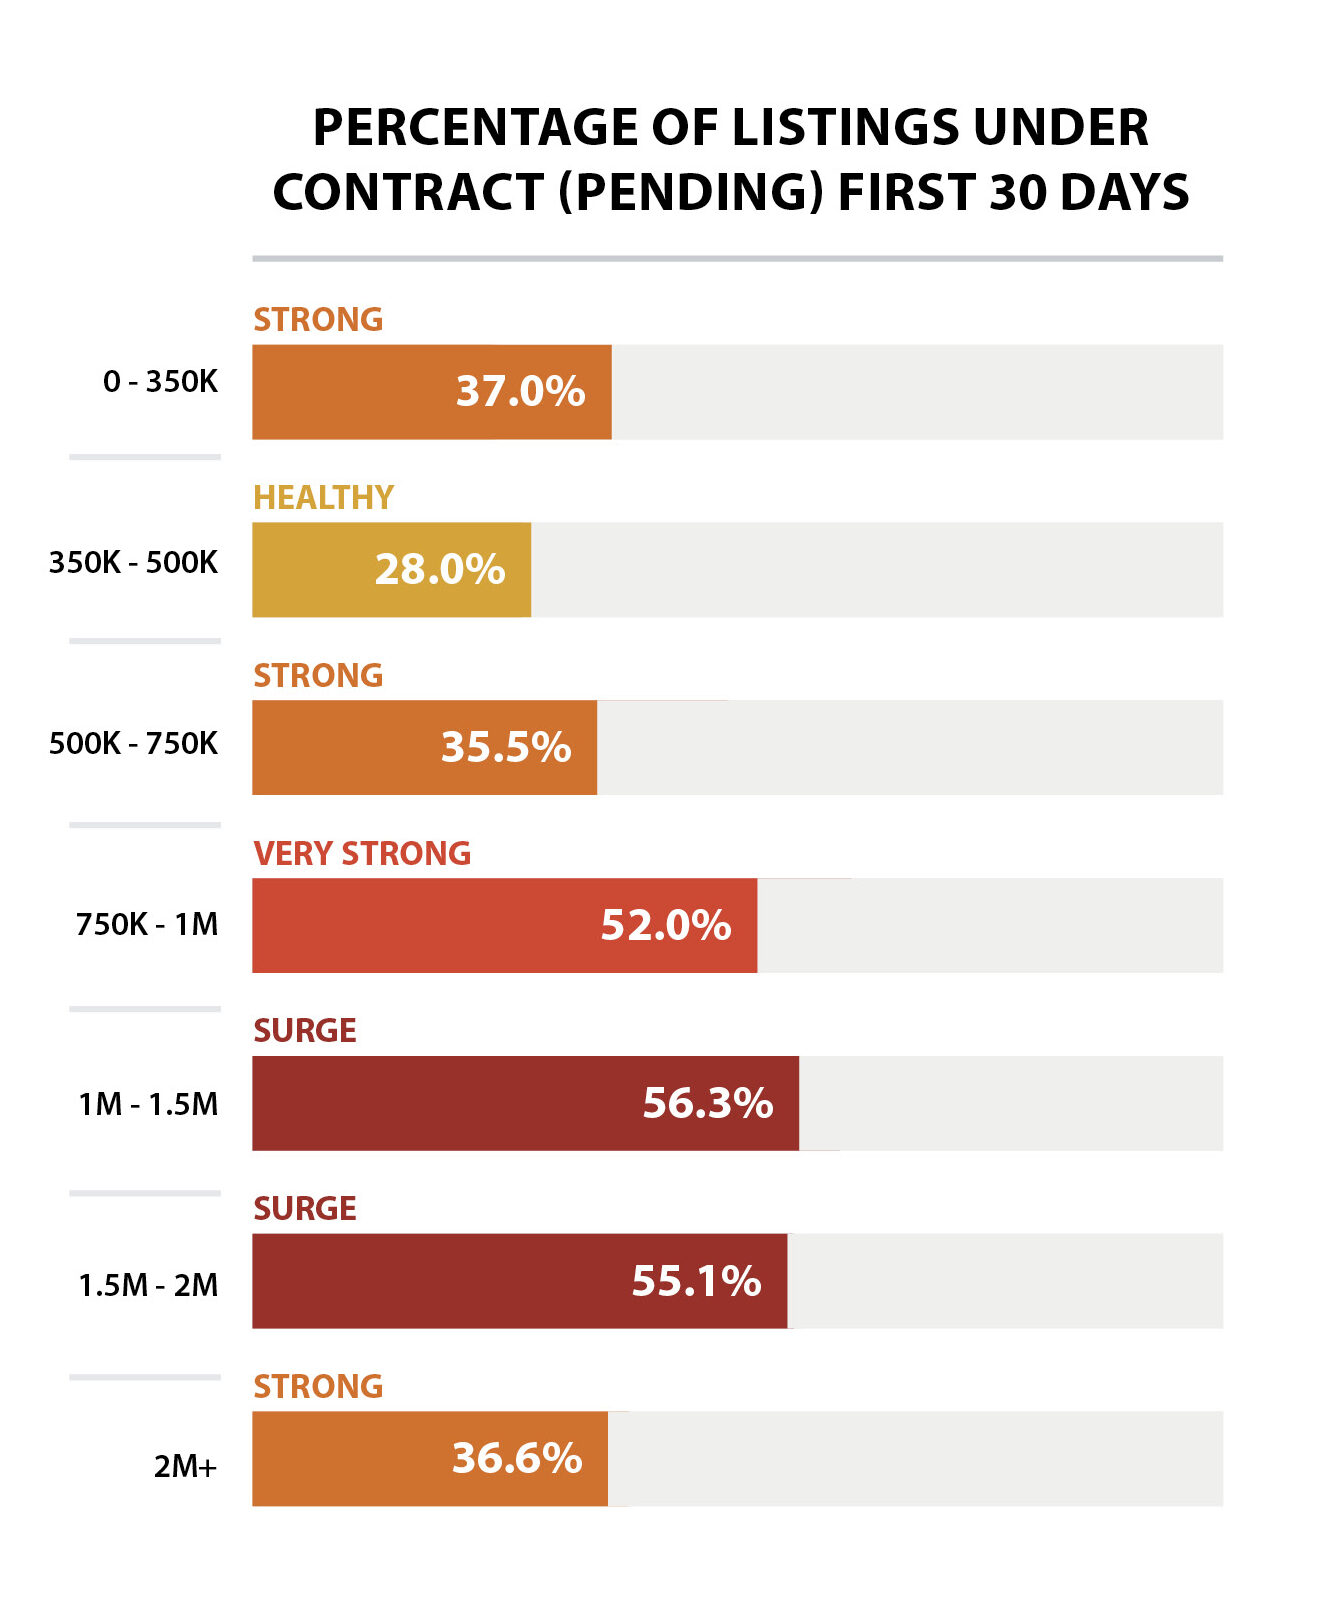
In June 2025, 44.6% of Seattle homes went pending within the first 30 days. That’s a noticeable dip from May’s 50.1%, nudging us out of “Surge” territory and into a more measured, yet still very competitive, “Very Strong” zone. The spring heat is cooling slightly—but don’t confuse this for a slowdown. It’s more like controlled speed.
Buyers are still showing up, but they’re moving with intention. With 2,006 new listings hitting the market, there’s more to pick from, and that means fewer impulse offers and more strategy. Homes in that $500K–$1.25M pocket? Still the sweet spot, still drawing strong offers, and still often going above asking—especially when priced right and looking sharp.
Even in the higher tiers—say, $1.5M to $2M—we’re seeing quick movement. Not frantic, but focused. Homes with smart floor plans, energy-efficient upgrades, and strong neighborhood vibes are landing buyers within the first month.
📌 Key Takeaways
For Buyers:
✔️ Almost half the market disappears within a month. If it fits your needs, don’t overthink it—just be ready to act fast. Pre-approval and strong terms still win the race.
For Sellers:
✔️ You’ve still got the upper hand—but only if your home checks the boxes. Buyers are decisive, not desperate. Hit the market clean, priced smart, and with perks that speak to lifestyle (think EV charging, outdoor living, or killer work-from-home space).
Bottom line? The pace has dialed back just a bit, but it’s still a sharp, seller-friendly market—just one where precision and polish matter more than ever.
PRICE
Seattle’s average residential resale price for June settled at $1,027,969—a slight month-over-month dip from May’s $1,053,527, but nothing that suggests the market’s cooling off. This is more of a recalibration than a retreat. With inventory rising and buyers getting pickier, sellers are pricing smarter, and the data shows it’s working.
By Property Type:
- 🏠 Single-Family Homes: $1,142,811
- 🏢 Condos: $683,180
These numbers are holding strong—and more importantly, they’re showing solid appreciation over time.
📈 Five-Year Appreciation Snapshot (Since June 2020)
- Overall Market: Up 24.1%
- Single-Family Homes: Up 25.3% (from $912,000 to $1,142,811)
- Condos: Up 22.7% (from $557,000 to $683,180)
Even with the occasional monthly dip, the long view shows undeniable strength. Seattle real estate remains one of the most reliable wealth-building tools in the region.
💰 Pricing Dynamics
- List-to-Sale Price Ratio: 100.9% — the average home is still going above list
- Condos: Selling at 99.5% of list price—steady, if slightly more price-sensitive
- Hot Zone: Homes in the $500K–$1.25M range are still the multiple-offer magnets
- Dated or overpriced listings? They’re sitting longer, facing price drops, and getting passed over
📌 Key Takeaways
For Sellers:
✔️ Your home has likely gained 20–30% in value over the past five years. That’s serious equity—but today’s buyers are savvy. To maximize returns, your pricing and presentation need to hit the mark out of the gate.
For Buyers:
✔️ Waiting for a price crash? Keep waiting. Seattle’s pricing trend may wobble, but it doesn’t fall. Lock in a home now, and let appreciation do the heavy lifting over time.
.
TIMING
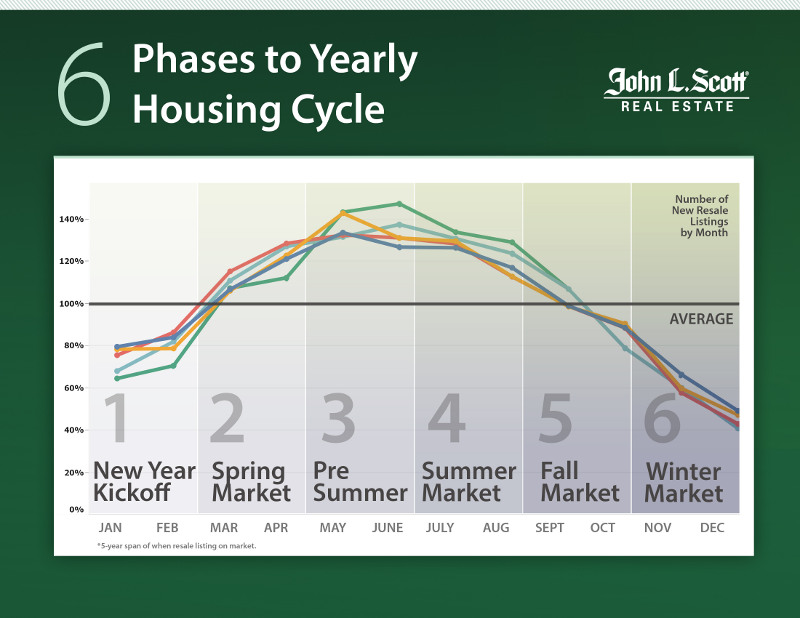
Welcome to the tail end of what John L. Scott dubs the Spring Surge Phase—and if you’ve been house hunting or listing this past month, you’ve definitely felt it. This is the busiest, boldest stretch of Seattle’s housing cycle, when listings spike, buyers show up in force, and the market runs hot.
Here’s what that looks like in real time:
- 🌷 2,006 new listings rolled out in June—our biggest listing month of the year
- 🚪 970 homes went pending, and 834 homes closed
- ⚔️ Homes under $1.25M are still the battleground—drawing the fiercest competition and fastest offers
Even with inventory rising to 2.5 months, demand is keeping pace. The surge hasn’t softened; it’s just become slightly more strategic. The frenzy of March and April is fading, but the energy is still high—and the opportunities are real.
📌 What This Means
For Sellers:
✔️ You’re in the golden window. More listings are coming, but motivated buyers are already here—and they’re writing strong offers. Use this moment to showcase your home’s seasonal appeal: patios, gardens, natural light, and proximity to parks or waterfront. Price it right, prep it well, and aim to hit the market before mid-summer slows things down.
For Buyers:
✔️ The flood of listings is here, but so are the crowds. If you’re serious, be fast and prepared. Homes under $1.25M are still drawing multiple offers and going pending fast—especially if they’re move-in ready. Pre-approval, flexibility, and confidence go a long way.
Bottom line: We’re at peak velocity for the season. Whether you’re buying or selling, now’s the time to act before the summer slowdown begins and the market shifts once again.
JOB AND POPULATION GROWTH
Washington State Non Farm Employment Numbers
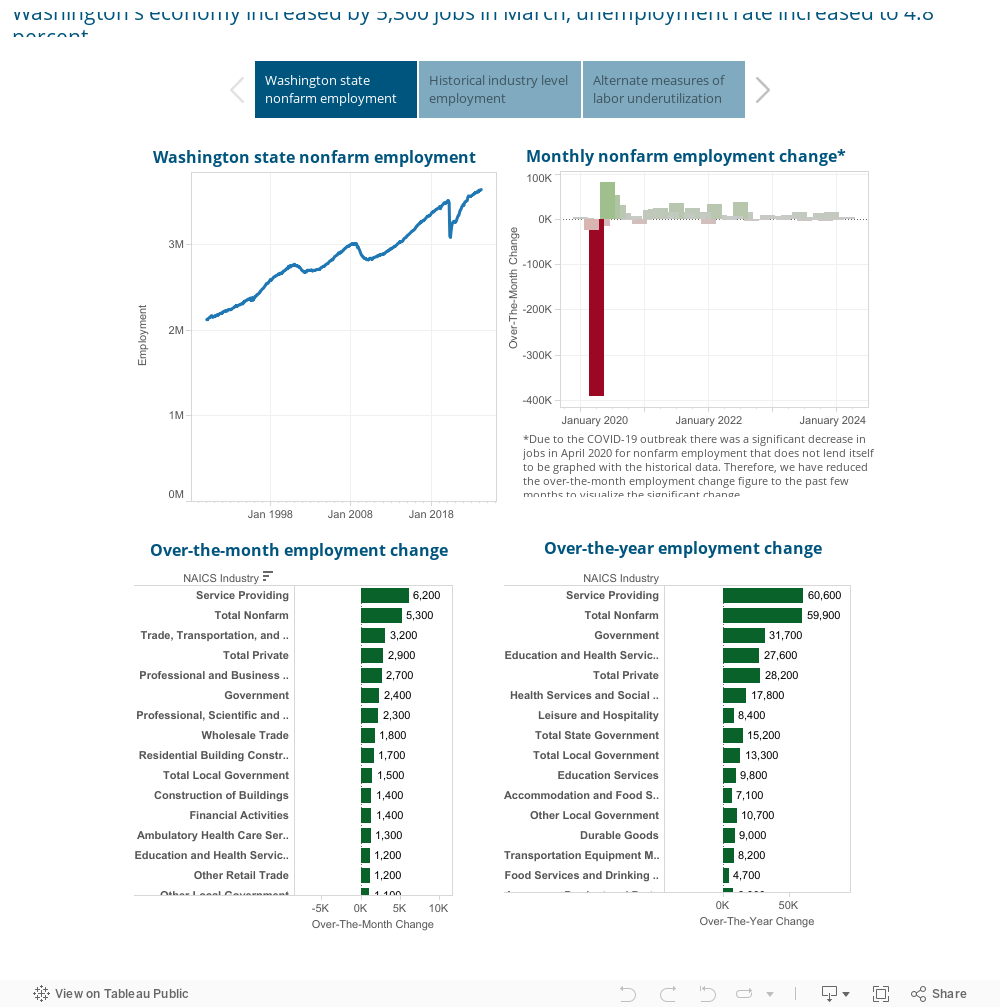
WA Employment Security Department
 [Source: U.S. Census Bureau]

Seattle Market Stats
STATS PROVIDED BY: INFOSPARK
RESIDENTAL RESALE
- $1,027,969 was the average sold price for listings in Seattle.
- 2,006 new listings went on the market this month.
- 2,917 homes were for sale during the month.
- 970 homes went pending in Seattle.
- 834 homes sold this month
- 2.5 months of inventory available in Seattle
- 25 was the average days on market for a home to sell in Seattle
- 100.9% was the average listing price vs. sales price percentage
- $585 was the average price per square foot in Seattle
- $857,325,771 was the total closed sales volume for Seattle
- 6.95% was the interest rate
- 44.6% of homes sold in the first 30 days in Seattle
- 12 Average showings to Pending
- 4.9 Showings per Listing
NEW CONSTRUCTION
- $965,522 was the average sold price for new construction in Seattle.
- 336 new construction listings went on the market this month.
- 580 new construction homes were for sale during the month.
- 132 new construction homes went pending in Seattle.
- 112 new construction homes sold this month
- 5 months of new construction inventory available in Seattle
- 27 was the average days on market for a new construction to sell in Seattle
- 99.5% was the average listing price vs. sales price percentage
- $638 was the average price per square foot in Seattle
- $108,138,433 was the total closed sales volume for Seattle
- 6.95% was the interest rate
- 9 Average showings to Pending
- 2.9 Showings per Listing
SEATTLE HOUSING MARKET Summary
As we wrap up June, the story is clear: Seattle’s housing market hasn’t just warmed up—it’s stayed hot, even as the pace becomes a little more thoughtful. We’re deep into the Spring Surge’s final stretch, and both buyers and sellers are showing up ready to play.
🕒 Homes are selling in just 25 days on average, up slightly from May—but still brisk by historical standards.
💰 List-to-sale price ratio holds at 100.9%, meaning well-prepped homes are still commanding strong offers, especially in that high-demand $500K–$1.25M bracket.
⚡ Sales Activity Intensity™ landed at 44.6% this month—down from 50.1%, but still solidly in “Very Strong” territory. The market’s cooled slightly from April’s frenzy, but it’s far from slow.
📉 Inventory climbed to 2.5 months, giving buyers more choice and sellers more reason to stay sharp. It’s the most balanced we’ve seen in years—without tipping into buyer’s market territory.
📊 Interest rates held steady at 6.95%, offering just enough predictability to keep buyers leaning in, even as affordability continues to weigh on decision-making.
Looking Ahead
📌 For Sellers:
You still hold the advantage—but only if you price to match today’s pace. Inventory is rising, and buyers are discerning. If your home’s under $1.5M, this is still your moment. Over that mark? Make sure your features shine and your launch is dialed.
📌 For Buyers:
Yes, there’s more to choose from—but the best homes are still going fast. Be ready with your pre-approval, a competitive strategy, and the willingness to act when the right one hits. This is a thinking buyer’s market—not a waiting one.
The Big Picture
Seattle’s market is moving with precision and purpose. Listings are up, but demand is steady. Sellers are negotiating—but only on homes that aren’t priced or presented right. And while buyers may not be stampeding, they’re out in force—and ready to strike when it counts.
If you’re buying, don’t wait for the summer slowdown to magically make things easier. The best opportunities are happening now. If you’re selling, this is your window. The Spring Surge is winding down, but the momentum is still here.
This market rewards prep, positioning, and expert guidance. It’s moving fast—but those who plan smart are winning big.
Share this post!