
SNOHOMISH COUNTY HOUSING MARKET FORECAST
Home Prices, Market Trends, Graphs Video and Infographics
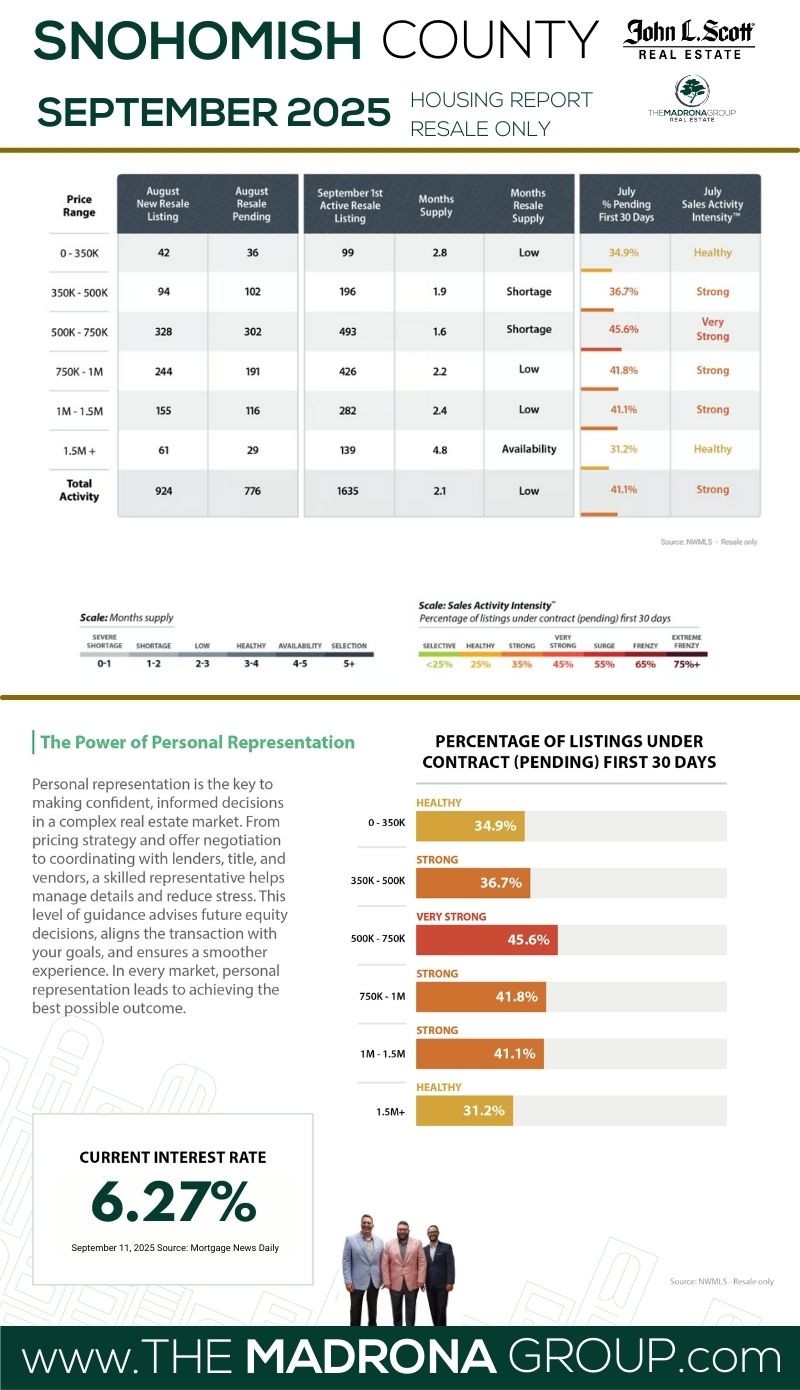
SNOHOMISH COUNTY HOUSING MARKET AT A GLANCE
Click Image To View Full Size
TABLE OF CONTENTS
3 KEY INDICATORS
Snohomish County Housing Market
- SALES ACTIVITY INTENSITY:
- 41.1% (STRONG)
- INTEREST RATE:
- 6.27% (MANAGEABLE)
- INVENTORY LEVEL:
- 2.1 Months (LOW)
THE BIG DEAL
The star of the show this month is mortgage rates. The 30-year fixed has slid to 6.27% (according to Mortgage News Daily on 9/11/25), the softest it’s been in almost a year. For buyers who’ve been sidelined by affordability math, this is a legit window of opportunity. Stack that with a 2/1 buydown — which drops first-year payments to about 4.27%, second-year to 5.27%, before settling into today’s rate — and suddenly homes that felt out of reach a few months ago are penciling out.From Rate Relief to Renewed Strength: Snohomish County Picks Up the Pace
"With rates at their lowest in nearly a year, buyers are back in the mix — and Snohomish County is showing fresh momentum." — Jason Fox, The Madrona Group
September brought a surprise twist: instead of slowing, Snohomish County’s housing market actually picked up speed. Sales Activity Intensity™ nudged up to 41.1%—still a Strong market—while the average 30-year mortgage rate slipped to 6.27%, the softest we’ve seen since 2024.
That combo—more affordable payments + steady demand—is giving sidelined buyers a reason to re-enter, and it’s showing up in stronger pending numbers. With 1,185 new listings and 2.1 months of resale inventory, Snohomish buyers have more options than spring but nowhere near the leverage of a true balanced market.
Well-priced homes in the $500K–$1M sweet spot are still the bullseye, often drawing multiple offers, while higher-end listings are benefiting from buyers who suddenly have more confidence to pull the trigger. Negotiations and concessions are back, but the edge is still with sellers who prep, price, and present well.
This month’s report unpacks resale trends, new-construction performance, and pricing shifts, showing how rate relief is fueling fresh buyer energy while keeping Snohomish County firmly in seller-skewed territory.
Detailed Explanation of the 3 Key Indicators
-
Sales Activity Intensity:
- Definition: This metric reflects the percentage of homes that go under contract within the first 30 days of listing. It's a direct indicator of the market's temperature, showing how quickly homes are moving from listing to pending status.
- Scale:
-
-
-
- <25%: Buyer's market – low demand, homes take longer to sell.
- 25%: Healthy market – balanced demand and supply.
- 35%: Strong market – increasing demand, sellers have a slight advantage.
- 45%: Very strong market – high demand, multiple offers are common.
- 55%: Surge – very high demand, significantly more buyers than available homes.
- 65%: Frenzy – extreme demand, homes sell extremely quickly, often well above asking price.
- 75%+: Extreme frenzy – unprecedented demand, highly competitive conditions.
-
Monthly Inventory Levels:
- Definition: This measures the number of months it would take to sell all current listings at the current sales pace without any new listings being added. It's a critical indicator of market balance.
- Scale:
- 0-1 month: Severe shortage – extremely low inventory, seller's market.
- 1-2 months: Shortage – low inventory, strong seller's advantage.
- 2-3 months: Low – less inventory, leaning towards sellers.
- 3-4 months: Healthy – balanced between buyers and sellers.
- 4-5 months: Selectability – more options for buyers, slight buyer's advantage.
- 5+ months: Buyer's market – high inventory, buyers have leverage.
-
Interest Rates:
- Definition: This refers to the average mortgage rate available to homebuyers. Interest rates are a significant factor affecting affordability and buyer demand.
- Scale (not a fixed scale but commonly accepted ranges):
- 3-4%: Excellent – very favorable for buyers.
- 5-6%: Good – relatively affordable for most buyers.
- 7-8%: Uncomfortable – can slow down buyer activity as financing becomes more expensive.
- 9-10%: Challenging – high rates can lead to decreased demand and slower market activity.
Sales Activity Intensity:
- Definition: This metric reflects the percentage of homes that go under contract within the first 30 days of listing. It's a direct indicator of the market's temperature, showing how quickly homes are moving from listing to pending status.
- Scale:
-
-
- <25%: Buyer's market – low demand, homes take longer to sell.
- 25%: Healthy market – balanced demand and supply.
- 35%: Strong market – increasing demand, sellers have a slight advantage.
- 45%: Very strong market – high demand, multiple offers are common.
- 55%: Surge – very high demand, significantly more buyers than available homes.
- 65%: Frenzy – extreme demand, homes sell extremely quickly, often well above asking price.
- 75%+: Extreme frenzy – unprecedented demand, highly competitive conditions.
-
Monthly Inventory Levels:
- Definition: This measures the number of months it would take to sell all current listings at the current sales pace without any new listings being added. It's a critical indicator of market balance.
- Scale:
- 0-1 month: Severe shortage – extremely low inventory, seller's market.
- 1-2 months: Shortage – low inventory, strong seller's advantage.
- 2-3 months: Low – less inventory, leaning towards sellers.
- 3-4 months: Healthy – balanced between buyers and sellers.
- 4-5 months: Selectability – more options for buyers, slight buyer's advantage.
- 5+ months: Buyer's market – high inventory, buyers have leverage.
Interest Rates:
- Definition: This refers to the average mortgage rate available to homebuyers. Interest rates are a significant factor affecting affordability and buyer demand.
- Scale (not a fixed scale but commonly accepted ranges):
- 3-4%: Excellent – very favorable for buyers.
- 5-6%: Good – relatively affordable for most buyers.
- 7-8%: Uncomfortable – can slow down buyer activity as financing becomes more expensive.
- 9-10%: Challenging – high rates can lead to decreased demand and slower market activity.
Each of these indicators plays a crucial role in interpreting the dynamics of the Seattle housing market. By analyzing trends within these metrics, we can better understand the forces at play, predict future movements, and strategize accordingly. Whether you're looking to buy a home, sell one, or simply keep an eye on market developments, these indicators provide the insights needed to navigate the complexities of Seattle's real estate landscape.
Sales Activity Intensity™
Snohomish County posted a 41.1% Sales Activity Intensity™ in September—a slight pickup from August’s 40.6% and proof that lower rates are already giving the market a boost. That keeps us firmly in a Strong market, with the tempo shifting from frenzy to focus. Homes are still moving—especially in the $500K–$800K sweet spot, where multiple offers remain common.
🕒 Average Days on Market: 32
👀 Showings to Pending: 11
🎯 Hot Zone: $500K–$800K — where demand is consistent and competition is steady
Well-priced, well-prepped homes in this range are still pulling quick offers. Listings that are dated or stretch too far on price are lingering.
📌 What This Means
For Buyers: You’ve got more breathing room, but Strong activity means you still need to move decisively when a home fits.
For Sellers: You still hold the edge—if you price to market and present like a pro. Overpricing = sitting.
Monthly Inventory Levels
Resale inventory landed at 2.1 months in September—slightly down from August’s 2.2 months, but still the most balanced selection buyers have had all year.
September saw 1,185 new listings, 975 homes pending, and 883 closings. Inventory remains well below the 4–6 months needed for a balanced market, but it’s enough to give buyers more choice and negotiating power than they’ve had in years.
📌 What This Means
For Buyers: More options and a bit more time—but the best homes still go quickly.
For Sellers: Competition is inching up—get ahead of it with sharp pricing and polished presentation.
Interest Rates
Rates dipped to an average of 6.27% in September—the lowest level in nearly a year. That’s giving sidelined buyers a reason to jump back in, with many using 2/1 buydowns or seller credits to lock in more affordable payments.
📌 What This Means
For Buyers: Don’t sit this one out—today’s rates open doors that felt closed earlier this year. Explore buydowns and creative financing to maximize your affordability.
For Sellers: Offering concessions like rate buydowns can attract more buyers without cutting list price.
Pricing Trends Over 5 Years
Month-to-month fluctuations aside, Snohomish County’s long-term picture remains rock solid:
🏡 Residential Resale
- Sept 2025 Avg. Price: $816,999
- Sept 2020 Avg. Price: $616,579
- 5-Year Change: ⬆️ 32.5%
🧱 New Construction
- Sept 2025 Avg. Price: $902,389
- Sept 2020 Avg. Price: $614,646
- 5-Year Change: ⬆️ 46.8%
🏢 Condos
- Sept 2025 Avg. Price: $543,501
- Sept 2020 Avg. Price: $427,936
- 5-Year Change: ⬆️ 27%
📌 What This Means
For Buyers: You’re stepping into proven long-term strength—this is equity growth, not a peak.
For Sellers: You’ve likely built significant equity—maximize it by pricing smart and presenting well.
Key Takeaways
For Sellers:
✔ List before deeper fall distractions slow momentum
✔ Price competitively—buyers are selective
✔ Incentives (like buydowns) can win buyers without cutting your list price
For Buyers:
✔ Have pre-approval in hand so you can act quickly
✔ Look for motivated sellers and builder incentives
✔ Expect competition in the $500K–$800K range
Rent vs. Buy in Snohomish County
- Avg. Rent (3-bed): ~$3,100/mo
- Mortgage on $500K @ 6.27% (20% down): ~$3,100/mo
📌 Bottom line: Staying 3+ years? Buying still beats renting for equity, stability, and wealth growth.
The Fed’s Influence
The Fed hasn’t made a major move yet, but expectations for easing in late 2025 are building. For now, mortgage rates are likely to hover 6–6.5%, with September’s dip to 6.27% already sparking stronger buyer activity.
📌 What This Means
For Buyers: Waiting for sub-5% could mean missing the homes you want.
For Sellers: Use incentives to counter rate fatigue—no price slash required.
Seasonality
We’re now in early-fall mode: more listings, slightly longer market times, and buyers who are active but selective.
September snapshot:
📦 Inventory: 2.1 months
🏡 New Listings: 1,185
🔁 Pending Sales: 975
✅ Closings: 883
This is a thoughtful, opportunity-driven market. Sellers still have the advantage, but the gap is narrowing as inventory holds steady and rates improve.
📌 What This Means
For Sellers: Competition is rising—act now, and invest in presentation to stand out.
For Buyers: More listings = more leverage—shop smart, negotiate where you can, and move quickly on the right home.
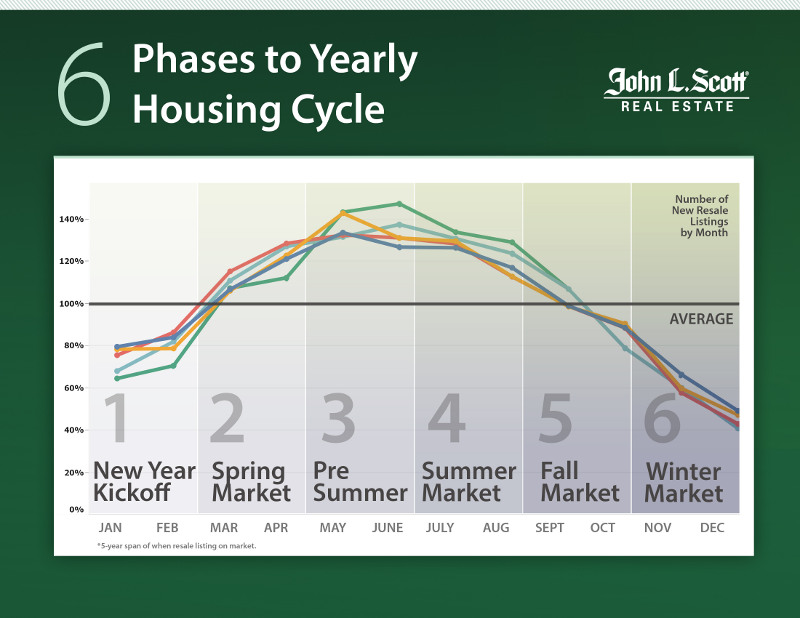
As we move into FallSeasonal patterns take hold as we see fewer new resale listings being added to the market than over the summer. September typically marks a high point of unsold inventory, offering buyers a brief window of good selection for the next two months. By January, unsold inventory will hit its annual low, with limited new listings expected over the winter until March. J Lennox Scott
LENNOX SCOTT
CEO of John L. Scott Real Estate

Snohomish County Real Estate GRAPHS & Data

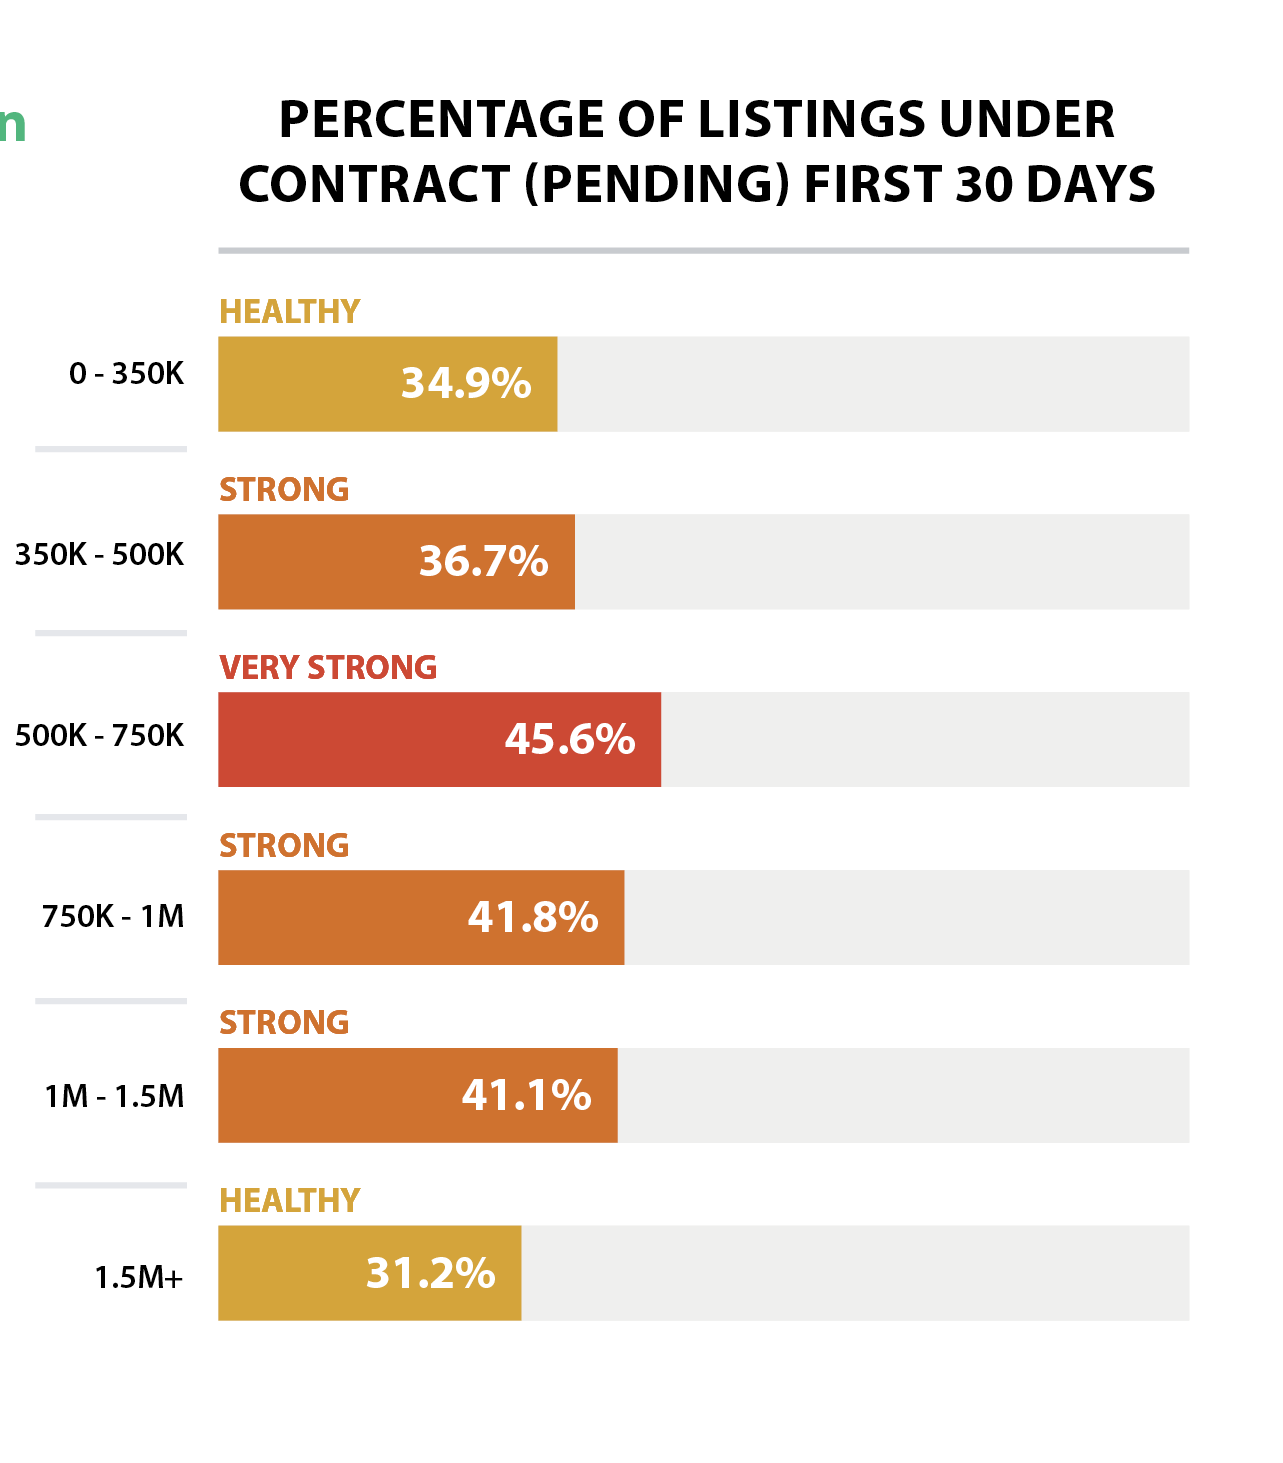
Snohomish County clocked in at a 41.1% Sales Activity Intensity™ for September, a tick up from August’s 40.6% and proof that lower mortgage rates are already nudging buyers back into the game. Just over 4 in 10 homes are going pending in the first 30 days — confirmation we’re still in a Strong market, even as the pace has shifted from frenzy to focus.
The $400K–$1M range continues to dominate activity, with many homes in that bracket moving within two weeks. Above $1.5M, homes are still selling — but only when they deliver on turnkey condition, great location, and sharp pricing.
🔁 Market Dynamics:
🕒 Average Days on Market: 32
✅ 975 homes went pending
📦 Inventory: 2.1 months
👀 Showings to Pending: 11
💥 Buyer urgency is present, especially with rates dipping to 6.27%
What we’re seeing now is precision over panic. Buyers are choosy but serious. Homes that shine in condition, price, and presentation are still pulling fast, clean offers. The rest? They’re waiting their turn.
📌 What This Means
For Buyers:
✔ Don’t sit on the good ones — 41% of listings are gone in under a month.
✔ Come pre-approved and ready to write; flexibility and clean terms still win.
✔ Competition is focused, but overlooked homes with longer DOM may be your best negotiation targets.
For Sellers:
✔ If you’re in the $400K–$1M range, you’re in the hot zone — but you must price and present sharply.
✔ Buyers are discerning, not desperate. Staging, curb appeal, and accurate pricing are non-negotiable.
✔ Want weekend offers? Hit the market polished and priced right.
PRICE
Home prices in Snohomish County held firm in September, with the average residential resale price at $816,999 — a slight seasonal step down from August but still well above last year. Even as rates eased to 6.27%, buyers stayed active, especially in the competitive $500K–$800K range where demand remains strong.
📊 By Property Type – September 2025
🏠 Single-Family Homes: $884,361
🏢 Condos: $543,501
📈 5-Year Appreciation Snapshot (Sept 2020 → Sept 2025)
- Overall Market: ⬆️ 32.5% (from $616,579 to $816,999)
- Single-Family Homes: ⬆️ 43.4% (from $616,579 to $884,361)
- Condos: ⬆️ 27% (from $427,936 to $543,501)
This isn’t just seasonal fluctuation — it’s sustained, multi-year equity growth. Even with affordability pressure, Snohomish County continues to reward homeowners with steady long-term appreciation.
💵 Pricing Dynamics
- List-to-Sale Price Ratio: 98.8% — most homes are closing just under asking
- Condos: Holding strong at near 99%
- Sweet Spot: $500K–$800K homes remain the fastest-moving and most competitive
- Overpriced or Dated Listings: Seeing extended DOM and inevitable price reductions
📌 Key Takeaways
For Sellers:
✔ You’ve likely built substantial equity — maximize it with strategic pricing and standout presentation.
✔ Homes with upgrades, smart layouts, and strong curb appeal are still commanding top dollar.
✔ Precision beats overconfidence in today’s market — buyers know their comps.
For Buyers:
✔ Prices remain on an upward trajectory — Snohomish is still building long-term value.
✔ Buying now locks in equity growth while rates are dipping.
✔ Waiting could mean paying more if rates fall further and competition heats up.
Spring’s frenzy is in the rearview — welcome to the early-fall market, where precision and preparation separate the serious from the sideline-watchers.
Snohomish County is still moving at a steady pace, but the energy has shifted from urgency to strategy. More listings, slightly longer market times, and softer rates are giving both buyers and sellers the chance to think before they leap — but not too long.
Here’s what September delivered:
✅ 975 homes went pending
🔑 883 homes closed
🕒 Average Days on Market: 32
📦 Inventory: 2.1 months — still tight, but offering the best selection of the year
📌 What This Means
For Sellers:
✔ This is still your season to shine — but the window is narrowing as fall distractions set in.
✔ List now while buyer demand is steady and inventory hasn’t tipped further upward.
✔ Sharp pricing and polished presentation are your ticket to standing out in a more selective market.
For Buyers:
✔ More inventory means more choice — but also more to weigh carefully.
✔ Homes in the $500K–$800K range remain the battleground, moving quickly in the right neighborhoods.
✔ This is the season for strategic offers, smart negotiations, and leveraging rate relief.
JOB AND POPULATION GROWTH
Washington State Non Farm Employment Numbers
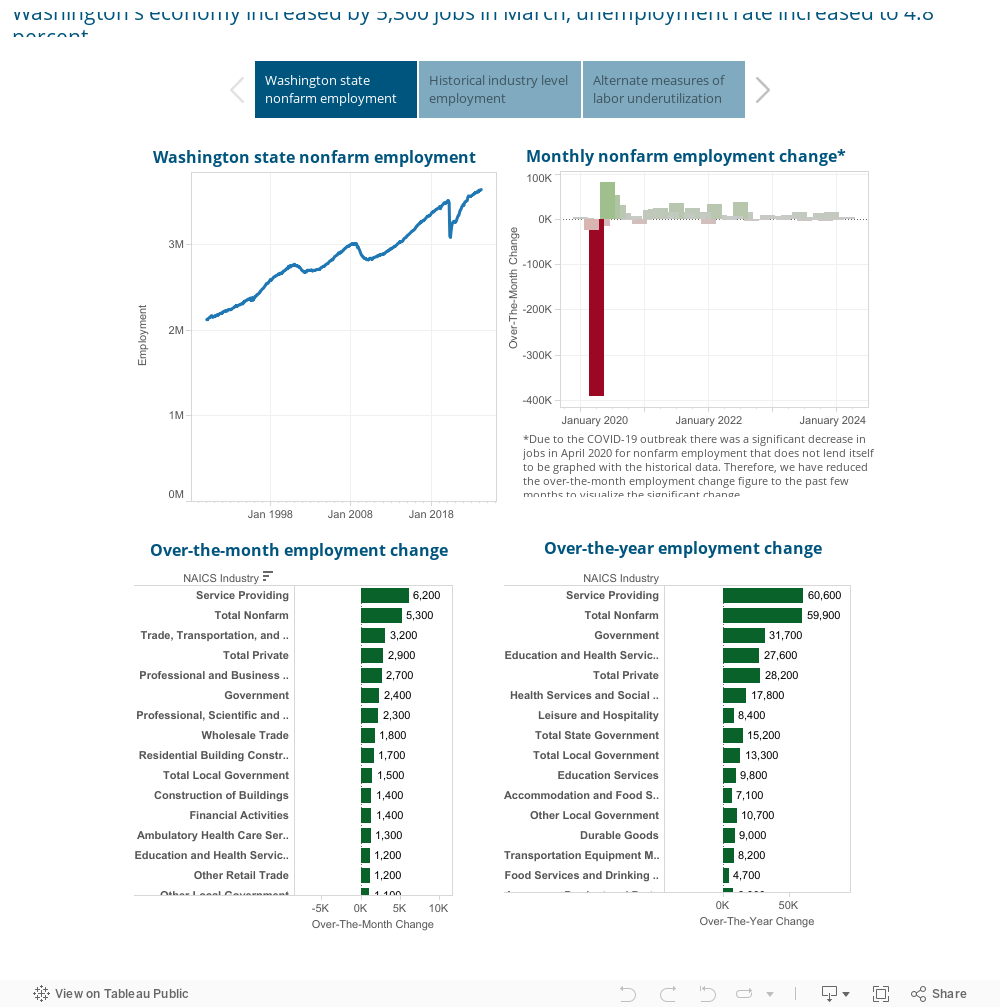
WA Employment Security Department
 [Source: U.S. Census Bureau]

Snohomish County Housing Market Stats
STATS PROVIDED BY: INFOSPARK
RESIDENTIAL RESALE
- $816,999 was the average sold price for listings in Snohomish County.
- 1,185 new listings went on the market this month.
- 2,404 homes were for sale during the month.
- 975 homes went pending in Snohomish County.
- 883 homes sold this month.
- 2.1 months of inventory available in Snohomish County.
- 32 was the average days on market for a home to sell in Snohomish County.
- 98.8% was the average listing price vs. sales price percentage.
- $411 was the average price per square foot in Snohomish County.
- $720,592,897 was the total closed sales volume for Snohomish County.
- 6.27% was the interest rate.
- 41.1% of homes sold in the first 30 days in Snohomish County.
- 11 Average showings to go pending.
- 4.4 Showings per listing.
NEW CONSTRUCTION
- $996,154 was the average sold price for new construction in Snohomish County.
- 178 new construction listings went on the market this month.
- 380 new construction homes were for sale during the month.
- 121 new construction homes went pending in Snohomish County.
- 143 new construction homes sold this month.
- 2.6 months of new construction inventory available in Snohomish County.
- 39 was the average days on market for new construction to sell.
- 99.7% was the average listing price vs. sales price percentage.
- $419 was the average price per square foot in Snohomish County.
- $141,453,826 was the total closed sales volume for Snohomish County.
- 6.63% was the interest rate.
- 4 Average showings to pending.
- 2.2 Showings per listing.
Snohomish County Housing Market Summary
Snohomish County’s early-fall market is moving with purpose — no longer the spring sprint, but far from idle. Buyers have a bit more breathing room, but the best homes still aren’t sticking around.
In September, 975 homes went pending and 883 closed, with inventory holding at 2.1 months — still seller-leaning, even as buyers enjoy the best selection of the year. Sales Activity Intensity™ clocked in at 41.1%, keeping us in the Strong zone and proving that more than 4 in 10 homes are going under contract within the first 30 days. Average market time stretched to 32 days, but well-priced homes in the hot zones continue to move quickly.
The $500K–$800K range remains the velocity zone, where sharp pricing and solid presentation can spark multiple offers. Above $1.5M, success hinges on luxury-level quality and location.
📌 What’s Working Now
For Sellers: The edge is still yours — but precision matters. Price to the market, prep thoroughly, and stand out with strong presentation. Overpricing = instant buyer drop-off.
For Buyers: More listings mean more choice and negotiating room, but the best homes still move quickly. Be prepared to write strong offers fast.
📊 The Big Picture
With mortgage rates easing to 6.27%, affordability just improved for the first time in months — and buyers are taking notice. Inventory is higher than spring but still well below balance, keeping sellers in control, especially in the mid-range.
Bottom line: Snohomish County’s September market is competitive, strategic, and newly energized by rate relief. The players who win right now aren’t just fast — they’re prepared.
Share this post!