
SEATTLE HOUSING MARKET FORECAST
Home Prices, Interest Rates, Real Estate Statistics, Video and Charts
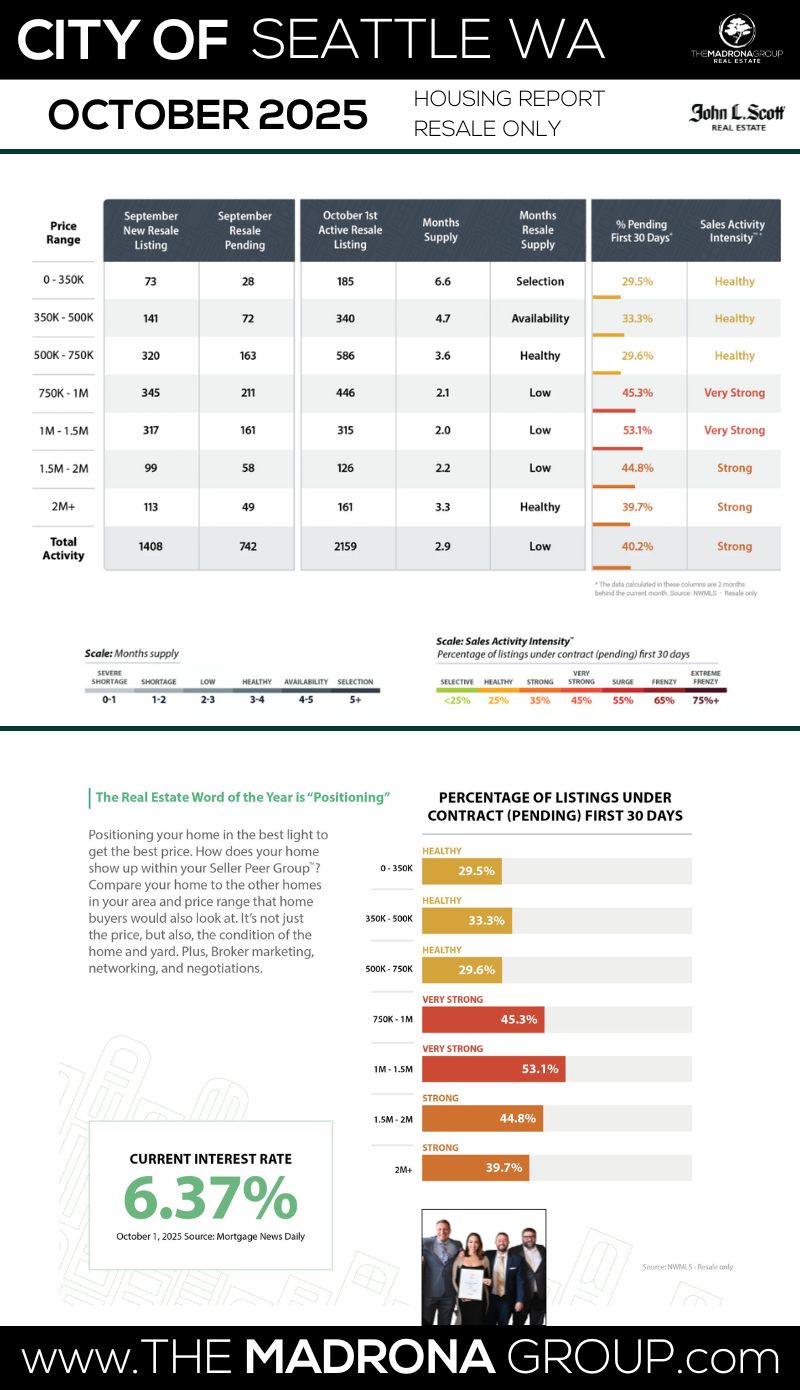
TABLE OF CONTENTS
3 KEY INDICATORS
Seattle Housing Market
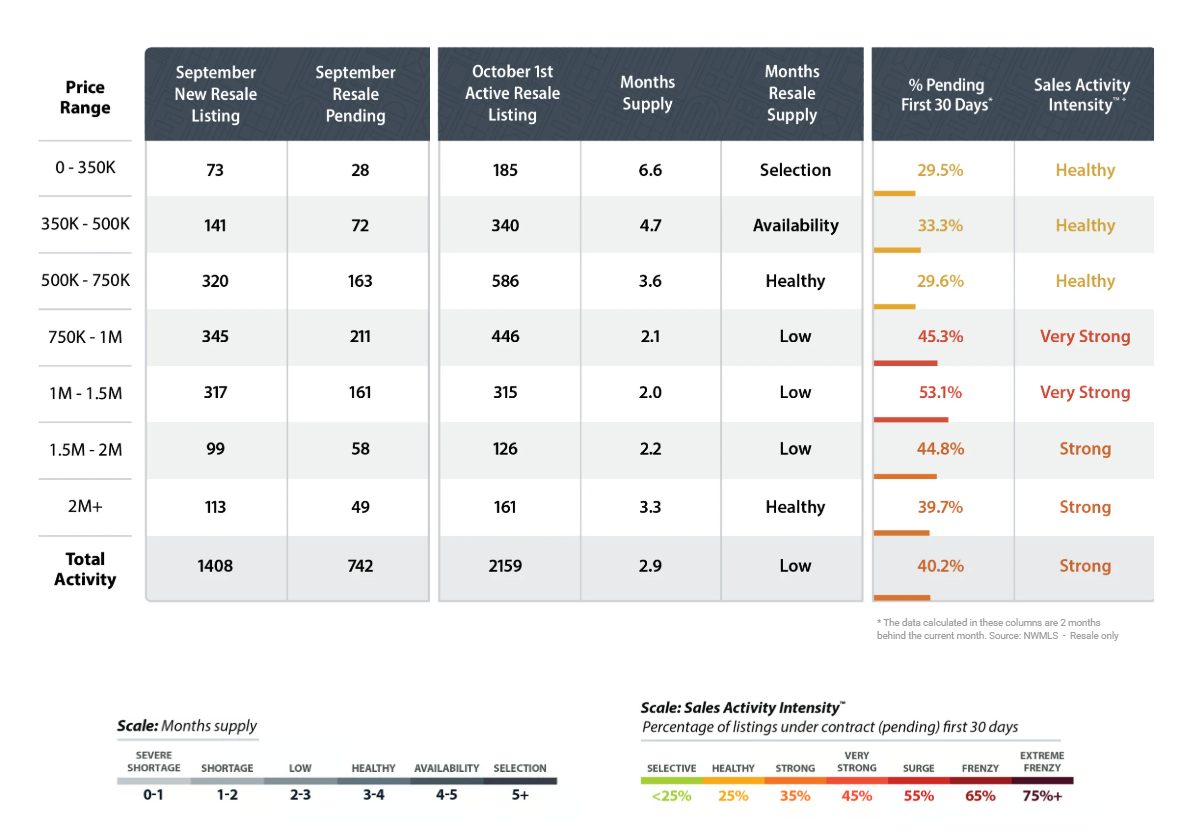
- SALES ACTIVITY INTENSITY:
- 40.2% (STRONG)
- INTEREST RATE:
- 6.37% (MANAGEABLE)
- INVENTORY LEVEL:
- 2.9 Months (LOW)
THE BIG DEAL
The 30-year fixed crept back up to 6.37%, yet sales activity intensity rose to 40.2%, holding steady in “Strong” territory. That combo — higher rates and higher activity — tells the real story: buyers are adapting, not retreating.
While affordability remains tight, the Seattle market’s refusing to tap the brakes. Buyers are using buydowns, seller concessions, and sharper negotiation to stay in the game — proof this isn’t a rate-driven retreat, it’s a resilience market.
From Resilience to Positioning: Seattle’s Market Refuses to Back Down
“Higher rates? Sure. But Seattle buyers didn’t get the memo.” — Jason Fox, The Madrona Group
Seattle’s housing market is proving that persistence pays. Despite mortgage rates inching back up to 6.37%, sales activity intensity actually rose to 40.2%, keeping the market firmly in Strong territory. Buyers aren’t bowing out — they’re adapting.
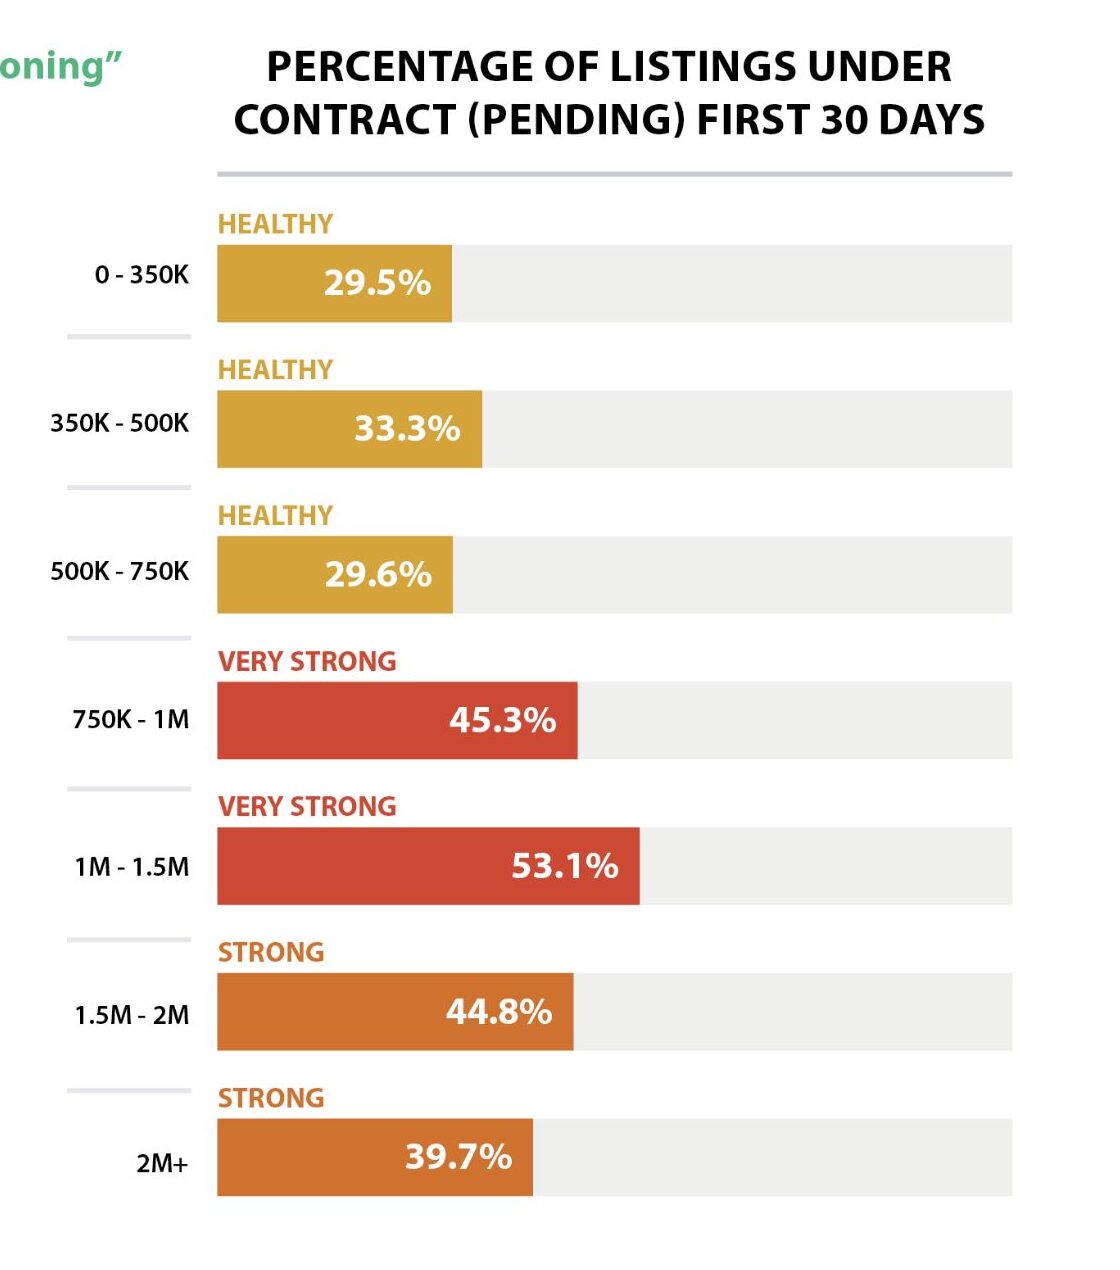
Sellers, meanwhile, are leaning into what John L. Scott calls the word of the year: “Positioning.” With inventory steady at 2.9 months, homes that are priced and presented with precision are still commanding attention.
The fall landscape looks like this:
-
Rates are slightly higher, but stability rules the day.
-
Inventory is holding steady — more choice than spring, less chaos than last year.
-
Sales activity has inched upward, proving Seattle’s market still has muscle.
This isn’t a wait-and-see market. It’s a watch-and-move market — where strategic pricing, sharp presentation, and well-prepped buyers are still closing strong.
Detailed Explanation of the 3 Key Indicators
-
Sales Activity Intensity:
- Definition: This metric reflects the percentage of homes that go under contract within the first 30 days of listing. It's a direct indicator of the market's temperature, showing how quickly homes are moving from listing to pending status.
- Scale:
-
-
-
- <25%: Buyer's market – low demand, homes take longer to sell.
- 25%: Healthy market – balanced demand and supply.
- 35%: Strong market – increasing demand, sellers have a slight advantage.
- 45%: Very strong market – high demand, multiple offers are common.
- 55%: Surge – very high demand, significantly more buyers than available homes.
- 65%: Frenzy – extreme demand, homes sell extremely quickly, often well above asking price.
- 75%+: Extreme frenzy – unprecedented demand, highly competitive conditions.
-
-
-
Monthly Inventory Levels:
- Definition: This measures the number of months it would take to sell all current listings at the current sales pace without any new listings being added. It's a critical indicator of market balance.
- Scale:
- 0-1 month: Severe shortage – extremely low inventory, seller's market.
- 1-2 months: Shortage – low inventory, strong seller's advantage.
- 2-3 months: Low – less inventory, leaning towards sellers.
- 3-4 months: Healthy – balanced between buyers and sellers.
- 4-5 months: Selectability – more options for buyers, slight buyer's advantage.
- 5+ months: Buyer's market – high inventory, buyers have leverage.
-
Interest Rates:
- Definition: This refers to the average mortgage rate available to homebuyers. Interest rates are a significant factor affecting affordability and buyer demand.
- Scale (not a fixed scale but commonly accepted ranges):
- 3-4%: Excellent – very favorable for buyers.
- 5-6%: Good – relatively affordable for most buyers.
- 7-8%: Uncomfortable – can slow down buyer activity as financing becomes more expensive.
- 9-10%: Challenging – high rates can lead to decreased demand and slower market activity.
Each of these indicators plays a crucial role in interpreting the dynamics of the Seattle housing market. By analyzing trends within these metrics, we can better understand the forces at play, predict future movements, and strategize accordingly. Whether you're looking to buy a home, sell one, or simply keep an eye on market developments, these indicators provide the insights needed to navigate the complexities of Seattle's real estate landscape.
Sales Activity Indicator: Still Strong at 40.2% — Resilient, Not Resting
How active is Seattle’s housing market right now?
Seattle’s housing market is holding its ground with 40.2% of homes going pending within the first 30 days — up slightly from September’s 39.9%. That keeps us squarely in the “Strong” zone, where roughly four in ten listings find buyers fast.
Spring’s frenzy (75% pending in 30 days) is long gone, but don’t mistake this calmer pace for weakness. October’s numbers show that buyer demand is adapting, not fading.
🔍 Market Snapshot:
- New Listings: 1,755
- Homes for Sale: 2,873
- Pending Sales: 866
- Closed Sales: 686
- Average Days on Market: 36
- Showings to Pending: 12
Even with slightly higher rates, activity nudged up. That’s resilience in real time.
📌 What This Means
For Buyers: You’ve got a bit more breathing room, but the best listings still vanish fast. Have financing dialed in — and move when you find the one.
For Sellers: Properly prepped, well-priced homes still pull serious offers. Overpricing is the fast track to collecting dust.
Monthly Inventory Levels: Holding Steady at 2.9 Months — A Balanced Pressure Zone
Is inventory giving buyers more room to breathe?
Yes — but only a little. Seattle’s 2.9 months of supply marks the highest level of 2025 and matches last month’s figure. That’s still the upper end of the “Low” range, meaning it’s a seller-leaning market with a touch of balance.
🔍 Inventory Breakdown:
- New Listings: 1,755
- Active Listings: 2,873
- Pending Sales: 866
- Closed Sales: 686
Homes are spending an average of 36 days on market, with about 4.4 showings per listing before going under contract.
The takeaway? Buyers finally have selection, but not control.
📌 What This Means
For Buyers: You can negotiate — especially on listings past 30 days or needing updates.
For Sellers: The competition is growing. Positioning your home — pricing, presentation, and timing — matters more than ever.
💬 “Thirty days remain of good selection and availability of homes for sale, until next March.” — Lennox Scott
Interest Rates: 6.37% – Slightly Higher, But Still Manageable
Are higher rates cooling demand?
Not yet. According to Mortgage News Daily (10/1/25), the 30-year fixed sits at 6.37%, up just a tick from September’s 6.27%. Despite that, Sales Activity Intensity rose, proving Seattle buyers are finding ways to make it work.
Creative financing, seller buydowns, and concessions are keeping deals alive. A 2/1 buydown can still shave early payments by 1–2%, softening the monthly sting.
📌 What This Means
For Buyers: Explore buydowns, adjustable-rate options, or closing-cost credits — flexibility is your edge.
For Sellers: Incentives like rate buydowns or concessions can attract buyers without cutting price.
Overall Market Trends: Cooling Seasonally, Still Seller-Strong
Is Seattle’s market slowing down for fall?
Yes — but it’s a strategic slowdown, not a stall. Inventory has plateaued, days on market are inching up, and price growth has softened. Yet homes are still selling at 99.4% of list price — proof that demand is still steady.
🔍 Quick Metrics:
- Average Resale Price: $983,432
- Average DOM: 36
- Sales-to-List Ratio: 99.4%
- Price per SqFt: $572
This is the kind of steady market where both sides can win — if they’re strategic.
📌 Takeaways
For Sellers:
✔ Inventory is at its 2025 high — list now, before competition thickens.
✔ Presentation, pricing, and positioning define success.
✔ Concessions can bridge the gap for rate-sensitive buyers.
For Buyers:
✔ You’ve got the most options you’ve had all year.
✔ Still act fast on move-in-ready homes.
✔ Look for longer-DOM listings for negotiation leverage.
Pricing vs. Historical Trends: Long-Term Strength Holds
Are Seattle home prices falling or holding?
They’re holding strong. Average resale prices dipped seasonally to $983,432, but long-term equity remains impressive:
| Property Type | Oct 2025 Avg Price | Oct 2020 Avg Price | 5-Year Change |
|---|---|---|---|
| Single-Family | $1,112,632 | $959,808 | ⬆ +15.9% |
| Condos | $635,171 | $583,756 | ⬆ +8.8% |
| New Construction | $954,733 | $953,517 | ⬆ +0.1% |
Even with a fall cooldown, Seattle’s long-term appreciation story is intact — this city builds wealth through every market cycle.
📌 TL;DR
Short-term softness, long-term strength. Don’t expect big discounts — expect stability.
Rent vs. Buy – The October Equation
Is it still better to buy than rent in Seattle right now?
In most cases, yes. Renting a 3-bed home in Seattle averages around $3,850/month. Buying a $700K home with 20% down at 6.37%? Monthly payments are roughly comparable — but only one builds equity.
Why Buying Still Wins:
- You lock in housing costs instead of chasing rent hikes.
- You build long-term wealth through appreciation.
- Negotiating power and concessions are better right now than they were in spring.
📌 If you’re planning to stay 3+ years, ownership remains the smarter play.
What About the Fed?
Will mortgage rates drop again soon?
The Fed hasn’t shifted its stance yet — it’s holding steady as inflation continues to cool. Economists expect mortgage rates to hover in the 6.25%–6.5% range through the end of 2025.
If inflation data continues improving, a small dip in early 2026 is possible — which could reignite buyer competition.
📌 What This Means
Buyers today get better negotiating power than they will once rates drop.
Sellers who price realistically now can still close strong before winter distractions hit.
Fall Seasonality: Slow, Strategic, and Still Moving
What does fall mean for Seattle real estate?
October brings cooler temps and calmer buyers — but the serious ones are still showing up. The frenzy is gone, replaced by strategy.
Homes are averaging 36 days on market, and selection remains the widest it’ll be until spring. Expect things to quiet further by mid-November, before inventory bottoms out in January.
📌 Pro Tips:
For Sellers:
✔ List now to capture motivated fall buyers.
✔ Highlight warmth, lighting, and curb appeal for seasonal showings.
✔ Price with precision — emotion-driven buyers are still out there.
For Buyers:
✔ Use slower pace to shop strategically.
✔ Negotiate closing costs or rate buydowns.
✔ Lock in before spring competition returns.
The word of the season is Positioning — and those who master it will win, no matter the rate.
Lower Home Mortgage Interest RatesLower rates have helped drive an increase in sales activity in September, compared to recent years. Especially in the mid-price ranges. Thirty days remain of good selection and availability of homes for sale, until next March J Lennox Scott
LENNOX SCOTT
CEO of John L. Scott Real Estate

Seattle Real Estate GRAPHS AND Data
Market Intensity: Focused, Not Frenzied
What does “market intensity” mean in Seattle real estate?
Market Intensity™ measures how many homes go pending within the first 30 days — it’s the heartbeat of competition. In Seattle, this stat shows how quickly buyers are snapping up homes once they hit the market.
How intense is Seattle’s housing market in October 2025?
The Seattle market clocked in at 40.2% Sales Activity Intensity™, up slightly from 39.9% in September — a small but meaningful gain. That keeps us in the “Strong” category, showing that nearly four in ten listings find buyers fast even as mortgage rates edge higher.
This “up-while-rates-up” combo tells you everything you need to know about Seattle right now: buyers aren’t backing off; they’re simply shopping smarter.
How does this compare to earlier in 2025?
Back in the spring surge (March – April), more than 75% of homes were going pending within the first month — what John L. Scott calls “Extreme Frenzy.” Since then, intensity has cooled three full tiers:
Extreme Frenzy → Surge → Very Strong → Strong.
That’s a normal seasonal correction — not a collapse. Demand is steady, pricing is rational, and listings are finally getting room to breathe.
Which price ranges are hottest right now?
The $500K–$1.25M range remains Seattle’s sweet spot — strong traffic, multiple offers on turnkey homes, and quick pendings for well-priced listings.
Homes between $1.5M–$2M+ are moving more selectively: buyers expect top-tier condition, modern design, and walkable locations before writing offers.
Luxury buyers are intentional, not impulsive. Think “polished presentation > price cut.”
What do showing trends reveal about buyer behavior?
- Average Showings to Pending: 12
- Showings per Listing: 4.4
That’s steady engagement — plenty of buyers are touring, but they’re more analytical before committing. Listings that check boxes on price, condition, and location still go quickly; the rest linger and adjust.
Is Seattle still a seller’s market?
Yes — but it’s now a strategy market, not a sprint. With 2.9 months of inventory, sellers still have the upper hand, but buyers have gained leverage. Homes are closing at 99.4% of list price, proving that accurate pricing wins and overreach gets punished.
What does this mean for buyers and sellers?
📌 For Buyers:
✔ Nearly 4 in 10 homes go pending in a month — be ready to act fast on well-priced listings.
✔ Pre-approval and clean terms still win deals.
✔ For negotiation power, look just above your budget at homes with longer DOM or recent price adjustments.
📌 For Sellers:
✔ You still hold the advantage — but precision is key.
✔ Professional staging, upgrades, and standout marketing are non-negotiable.
✔ Lifestyle perks (EV chargers, outdoor living, home-office space) are today’s tie-breakers.
Bottom Line: What’s the real vibe of Seattle’s market right now?
The heat dialed down, but the competition didn’t vanish. Seattle’s market has evolved from chaotic to calculated — still seller-leaning, but powered by informed, strategic buyers.
Precision over panic.
That’s how homes get sold in Seattle this fall.
MARKET INTENSITY
Market Intensity: Focused, Not Frenzied
What does “market intensity” mean in Seattle real estate
Market Intensity™ measures how many homes go pending within the first 30 days — the truest signal of competition and market heat. It’s Seattle’s version of a “market pulse,” showing how fast buyers are moving when they see something they like.
How intense is Seattle’s housing market in October 2025
Seattle posted a Sales Activity Intensity™ of 40.2%, up slightly from 39.9% in September. That keeps us squarely in the Strong zone — proof that even with slightly higher mortgage rates, buyers are still active and ready.
The slight uptick in intensity while rates ticked up to 6.37% says it all: Seattle buyers aren’t bowing out; they’re adapting.
How does this compare to earlier in 2025
Back in March and April, intensity hit 75% — “Extreme Frenzy” levels. Since then, the market has cooled through three full tiers:
Extreme Frenzy → Surge → Very Strong → Strong.
This is a normal seasonal correction, not a downturn. The market shifted from frantic to focused — and that’s healthy.
Which price ranges are hottest right now
Homes priced between $500K and $1.25M are still the battleground, driving most of Seattle’s multiple-offer activity. Clean, move-in-ready homes in good school zones or walkable neighborhoods continue to attract strong buyer competition.
Above $1.5M, the story changes — buyers are more selective. Well-designed, energy-efficient, and turnkey properties sell; the rest linger. Luxury buyers want HGTV-level polish before they write checks.
What do showing trends reveal about buyer behavior
-
Average Showings to Pending: 12
-
Showings per Listing: 4.4
Buyers are still out there — just more deliberate. Homes that hit the sweet spot on price and presentation move quickly. Listings that miss the mark sit longer and adjust down.
Is Seattle still a seller’s market
Yes — but it’s also a strategy market. With 2.9 months of inventory, sellers still have leverage, but buyers are smarter and slower to rush. The average home is closing at 99.4% of list price, meaning value still matters more than discounts.
What this means for buyers and sellers
For Buyers:
✔ Roughly 4 in 10 homes sell in the first month — act fast on the right ones.
✔ Pre-approval and strong terms still win in this market.
✔ Look for opportunity in longer-DOM or slightly overpriced listings.
For Sellers:
✔ You have the upper hand, but precision is everything.
✔ Staging, updates, and standout marketing are table stakes.
✔ Highlight lifestyle perks — outdoor spaces, EV setups, and smart-home features.
Bottom Line
The frenzy is gone, but the fight isn’t. Seattle’s market has evolved from chaotic to calculated — still competitive, still seller-leaning, and still rewarding the prepared.
Precision over panic. Always.
PRICE
Price: Seasonal Dip, Long-Term Strength
How are Seattle home prices trending in October 2025
Seattle’s average residential resale price came in at $983,432 this month — a seasonal pullback from summer highs but well within expected fall behavior. Sellers are adjusting strategies, not slashing prices.
Homes continue closing at 99.4% of list, showing that well-positioned properties are still commanding strong results.
What are the average prices by property type
| Property Type | Oct 2025 Avg Price | Oct 2020 Avg Price | 5-Year Change |
|---|---|---|---|
| Single-Family Homes | $1,112,632 | $959,808 | ⬆ +15.9% |
| Condos | $635,171 | $583,756 | ⬆ +8.8% |
| New Construction | $954,733 | $953,517 | ⬆ +0.1% |
The single-family market continues to drive long-term equity, condos have regained steady traction post-pandemic, and new construction remains price-stable but slower to move due to higher build costs and longer timelines.
How does this compare to September 2025
-
Resale price: Down from $1,094,986 → $983,432
-
DOM: Up from 34 → 36 days
-
Inventory: Holding steady at 2.9 months
That’s a typical fall adjustment — not a sign of weakness. Seattle’s yearly pattern always cools from August through December before tightening again in spring.
What’s happening with list-to-sale ratios
At 99.4%, Seattle homes are still selling close to asking. Buyers are negotiating on presentation or location, not on price fundamentals. The key difference between homes that sell and homes that sit? Precision pricing and polished presentation.
What’s driving long-term pricing strength
Seattle’s job market, tech sector recovery, and population stability continue to support long-term appreciation.
Since 2020, home values are up 8–16% across most property types. Even after rate shocks, that’s remarkable resilience — proof that owning in Seattle is still one of the region’s best long-term wealth plays.
What this means for buyers and sellers
For Sellers:
✔ If you’ve owned 5+ years, you’re likely sitting on major equity.
✔ Price in line with today’s market — buyers know their comps.
✔ Presentation and positioning define your outcome.
For Buyers:
✔ Seasonal dips are your window.
✔ Big price drops aren’t coming — just opportunities on the edges.
✔ Buy now, refi later when rates ease.
Bottom Line
Seattle pricing remains strong, stable, and strategic. The frenzy faded, but equity didn’t.
If you’re waiting for a crash, you’ll miss the correction that already happened.
This is the balance-before-the-bounce phase — and it’s favoring the ready.
TIMING
The Strategic Slowdown Before the Winter Reset
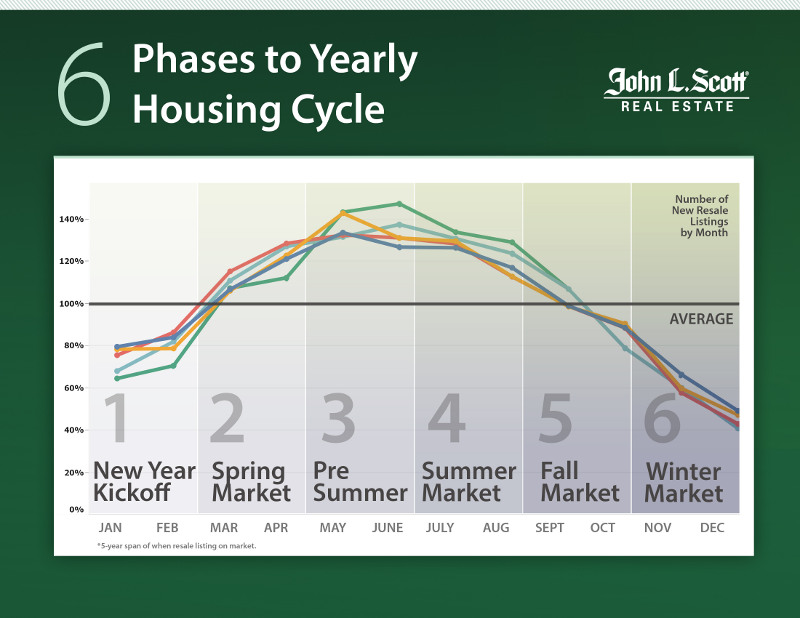
Where are we in Seattle’s yearly housing cycle
We’ve officially hit the early-fall cooldown — that sweet spot between the post-summer slowdown and the pre-holiday hibernation. Activity is steady, not sleepy.
Historically, October brings fewer listings and longer days on market, but motivated buyers are still out there. The sprint of spring is gone; this is the strategy phase — where clean pricing, solid prep, and timing make all the difference.
What are the current Seattle housing stats telling us about timing
October’s numbers paint a picture of measured momentum:
- New Listings: 1,755
- Homes for Sale: 2,873
- Pending Sales: 866
- Closed Sales: 686
- Average Days on Market: 36
- Sales-to-List Price Ratio: 99.4%
- Inventory: 2.9 months (highest level of 2025)
Despite higher mortgage rates (6.37%), buyers haven’t checked out — they’ve just become more deliberate. This market rewards readiness, not recklessness.
How does seasonality affect buyers and sellers right now
For Sellers:
October is your last good window before winter quiet sets in. Serious buyers are still shopping, but the crowd will thin by mid-November. Homes that list now can still close before year-end.
✔ Present your home with intention — staging, lighting, and curb appeal are seasonal differentiators.
✔ List before Thanksgiving to avoid the holiday dip in showings.
✔ Consider offering incentives like buydowns to widen your buyer pool.
For Buyers:
October through January is prime time for opportunity.
✔ You’ll face fewer competing offers.
✔ Sellers with longer days on market are more negotiable.
✔ Use this season’s slower pace to shop smart, not fast.
How does this timing compare to earlier in 2025
In spring 2025, homes flew off the market — 75% went pending in the first 30 days. By summer, the frenzy cooled but remained strong.
Now in October, we’re seeing balance: steady sales, moderate competition, and pricing discipline.
Translation: This isn’t a “wait and see” market — it’s a “wait and move smart” market.
What does timing look like heading into winter and spring 2026
Expect inventory to taper through December, hitting its annual low in January. New listings typically restart in March, marking the beginning of Seattle’s next buying wave.
Those who prep now — whether it’s staging a home for early 2026 listing or locking a purchase before the next rate drop — will be positioned to win when the market heats back up.
“Lower rates have helped drive an increase in sales activity in September compared to recent years. Thirty days remain of good selection and availability of homes for sale, until next March.” — Lennox Scott
Bottom Line
We’ve entered the strategic slowdown — a rare equilibrium where buyers gain leverage and sellers still have control.
This is the calm before the next cycle, and the players who plan now will own spring.
Smart beats fast. Preparation beats panic. Always.
JOB AND POPULATION GROWTH
Washington State Non Farm Employment Numbers
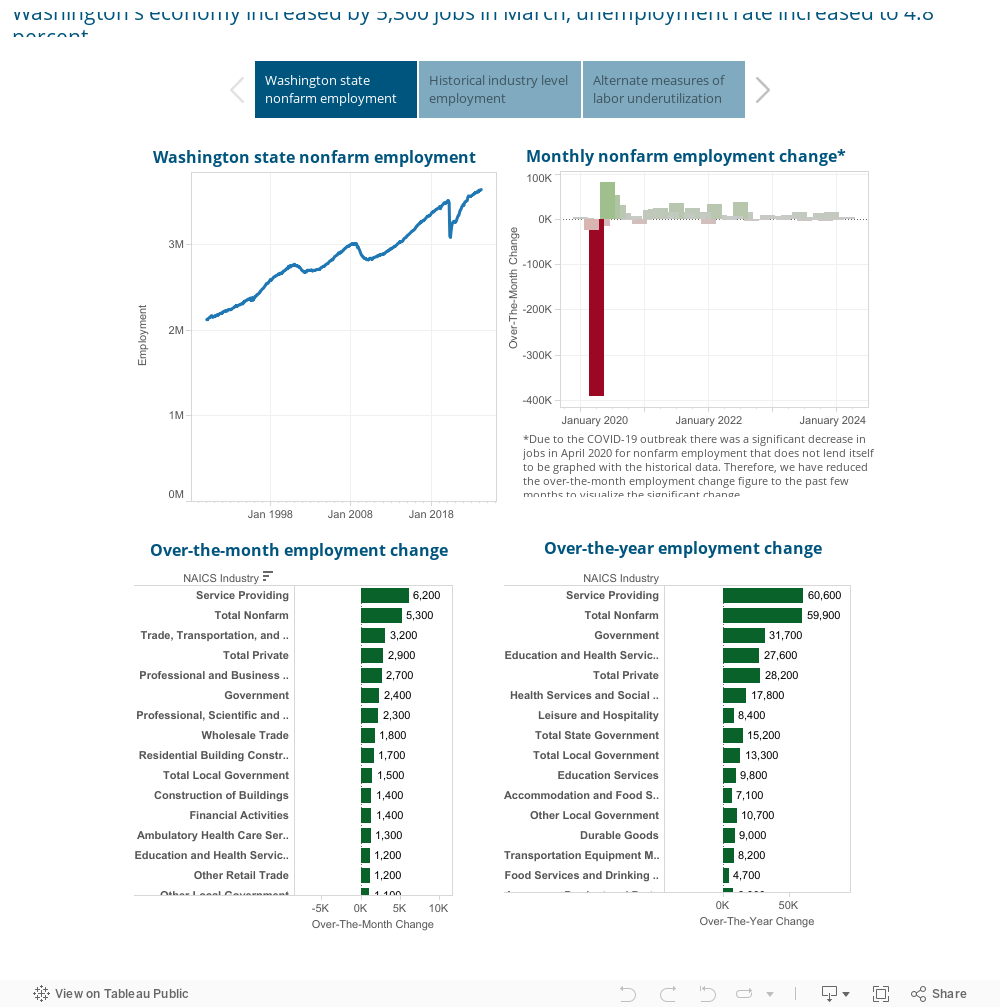
WA Employment Security Department
 [Source: U.S. Census Bureau]

Seattle Market Stats
STATS PROVIDED BY: INFOSPARK
How is the Seattle real estate market performing this month
Seattle’s housing market stayed strong and steady through October 2025, despite slightly higher mortgage rates.
Inventory is holding at its yearly peak, and homes continue to close just shy of list price — a sign that the market remains healthy, selective, and strategic.
Residential Real Estate – Seattle October 2025
Category
October 2025
Trend vs. September 2025
Market Insight
Sales Activity Intensity™
40.2% (Strong)
⬆ Up slightly from 39.9%
Buyers adapting despite rate increase.
Average Sales Price
$983,432
⬇ Down from $1,094,986
Seasonal adjustment, not a decline.
Average Single-Family Price
$1,112,632
⬇ Slight dip
Still up +15.9% over 5 years.
Average Condo Price
$635,171
⬇ Down from $717,434
Price-sensitive, steady demand.
New Listings
1,755
⬇ Down from 1,085 (Sept saw fewer new listings)
Typical seasonal slowdown.
Homes for Sale
2,873
⬆ Up from 2,660
Highest inventory level in 2025.
Pending Sales
866
⬆ From 779
Demand holding steady.
Closed Sales
686
⬇ From 798
Reflects slower September pendings.
Inventory (Months Supply)
2.9 Months
➡ Flat
Balanced between buyer and seller leverage.
Average Days on Market (DOM)
36
⬆ From 34
More buyer deliberation.
Sales-to-List Price Ratio
99.4%
➡ Flat
Market remains price-disciplined.
Average Price per SqFt
$572
⬇ From $578
Minor seasonal softening.
Total Closed Sales Volume
$678,169,555
⬇ Down from $870M+
Reflects fewer closings, not lower demand.
Average Shows to Pending
12
➡ Flat
Buyers active, but cautious.
Average Shows per Listing
4.4
⬆ Slightly
Listings getting more eyes before offer.
Interest Rate (30-Year Fixed)
6.37%
⬆ From 6.27%
Manageable, still within buyer range.
| Category | October 2025 | Trend vs. September 2025 | Market Insight |
|---|---|---|---|
| Sales Activity Intensity™ | 40.2% (Strong) | ⬆ Up slightly from 39.9% | Buyers adapting despite rate increase. |
| Average Sales Price | $983,432 | ⬇ Down from $1,094,986 | Seasonal adjustment, not a decline. |
| Average Single-Family Price | $1,112,632 | ⬇ Slight dip | Still up +15.9% over 5 years. |
| Average Condo Price | $635,171 | ⬇ Down from $717,434 | Price-sensitive, steady demand. |
| New Listings | 1,755 | ⬇ Down from 1,085 (Sept saw fewer new listings) | Typical seasonal slowdown. |
| Homes for Sale | 2,873 | ⬆ Up from 2,660 | Highest inventory level in 2025. |
| Pending Sales | 866 | ⬆ From 779 | Demand holding steady. |
| Closed Sales | 686 | ⬇ From 798 | Reflects slower September pendings. |
| Inventory (Months Supply) | 2.9 Months | ➡ Flat | Balanced between buyer and seller leverage. |
| Average Days on Market (DOM) | 36 | ⬆ From 34 | More buyer deliberation. |
| Sales-to-List Price Ratio | 99.4% | ➡ Flat | Market remains price-disciplined. |
| Average Price per SqFt | $572 | ⬇ From $578 | Minor seasonal softening. |
| Total Closed Sales Volume | $678,169,555 | ⬇ Down from $870M+ | Reflects fewer closings, not lower demand. |
| Average Shows to Pending | 12 | ➡ Flat | Buyers active, but cautious. |
| Average Shows per Listing | 4.4 | ⬆ Slightly | Listings getting more eyes before offer. |
| Interest Rate (30-Year Fixed) | 6.37% | ⬆ From 6.27% | Manageable, still within buyer range. |
📌 Key Takeaway:
Seattle’s resale market continues to hum at a strong, steady pace. The slight uptick in activity despite higher rates shows a market powered by buyer resilience and smart seller strategy.
New Construction – Seattle October 2025
| Category | October 2025 | Trend vs. September 2025 | Market Insight |
|---|---|---|---|
| Average Sales Price | $954,733 | ⬆ Slightly from $949,846 | Stable new-construction pricing. |
| 5-Year Comparison (2020) | $953,517 | ➡ Essentially Flat | New builds holding value over time. |
| New Listings | 357 | ⬆ From 210 | Builders releasing inventory before winter. |
| Homes for Sale | 580 | ⬆ From 532 | Slight supply increase, easing competition. |
| Pending Sales | 142 | ⬆ From 121 | Buyers still interested in turnkey homes. |
| Closed Sales | 83 | ⬇ From 121 | Seasonal closing slowdown. |
| Months of Supply | 4.9 Months | ⬆ From 4.6 | Moving into “Selectability” range — buyer advantage emerging. |
| Average Days on Market | 45 | ⬆ From 35 | Reflecting longer decision timelines. |
| Sold-to-List Price Ratio | 99.2% | ⬇ Slightly | Builders offering incentives and rate buydowns. |
| Average Price per SqFt | $655 | ⬆ From $653 | Construction costs steady. |
| Total Closed Volume | $79,242,849 | ⬇ From $114.9M | Fewer units closed in October. |
| Shows to Pending | 10 | ➡ Flat | Buyer demand consistent. |
| Shows per Listing | 2.9 | ⬇ Slightly | More inventory, spreading showings across homes. |
📌 Key Takeaway:
New construction is shifting into a selectability phase — buyers have choices, and builders are responding with incentives. The best-positioned homes (great design, great location) still move quickly; the rest will need sharper pricing or buydowns to attract attention.
Overall Snapshot
- Sales Activity Intensity™: 40.2% (Strong)
- Inventory: 2.9 Months (Low to Balanced)
- Interest Rate: 6.37% (Manageable)
- Market Type: Seller-leaning but strategy-driven
- Buyer Mindset: Calculated, not casual
- Seller Strategy: Positioning, not guessing
Bottom Line
October 2025 cemented Seattle’s transition from frenzied to focused.
Inventory has peaked, rates remain steady, and market activity refuses to fade. This is a strategy market through and through — one that rewards sellers who position well and buyers who prepare early.
SEATTLE HOUSING MARKET Summary
How is Seattle’s housing market wrapping up this fall
Seattle’s fall market is closing out the year exactly how strong markets should — steady, selective, and still seller-leaning.
Mortgage rates ticked up slightly, yet sales activity intensity increased, proving buyers are adapting instead of retreating. Sellers who positioned their homes right — priced smart, prepped well, and marketed strategically — continued to land strong offers.
The word that defined this fall: resilience.
Recap of the Three Key Indicators
| Key Indicator | October 2025 | Interpretation |
|---|---|---|
| Sales Activity Intensity™ | 40.2% (Strong) | Demand is holding steady; 4 in 10 homes go pending in 30 days. |
| Inventory | 2.9 Months (Low) | Highest of 2025, offering buyers more selection but not control. |
| Interest Rate (30-Year Fixed) | 6.37% (Manageable) | Slightly higher, yet demand held — proof of buyer resilience. |
Together, these three metrics signal a strong, balanced fall market. The frenzy is gone, but the fundamentals remain solid.
What’s Working Now
For Sellers:
✔ Precision pricing and top-tier presentation win.
✔ Offer rate buydowns or concessions before slashing list price.
✔ List before mid-November for maximum buyer exposure.
For Buyers:
✔ You’ve got options, but timing is key — rates are stable, and inventory will shrink by January.
✔ Target listings with 30+ days on market for negotiation potential.
✔ Lock in now, refi later — equity and appreciation are still in your favor.
Market Outlook for Winter and Early 2026
Expect inventory to taper through the holidays, hitting its annual low by January. With rates likely holding near the 6.25%–6.5% range, early 2026 could bring a fresh wave of demand as buyers reenter the market ahead of spring listings.
Translation: This calm stretch is your prep window. Sellers who position early and buyers who act before the next wave of competition will win the new year.
Final Take
Seattle’s 2025 story ends with balance — not burnout.
Inventory found its footing. Buyers stayed engaged. Sellers adapted.
This isn’t a market on pause; it’s a market in precision mode.
Bottom line:
This isn’t a wait-and-see market — it’s a watch-and-move market.
The players who plan now will own spring 2026.
Share this post!