
Seattle Housing Market Report November 2026
Seattle buyers have more homes to compare than a year ago, and fewer buyers are making offers. October ended with 3,487 homes for sale and 636 pending sales. The citywide median sale price was $895,000, but houses, townhomes and condos tell different stories. For sellers, the three Ps matter: price right, present right and promote right. For buyers, use the opportunity to compare carefully and negotiate a move that works.

Seattle at a glance
More choice than last year. Fewer accepted offers.
The right price and presentation still matter.
Interest rates
30-year fixed · MND November 4
Inventory
Active listings · +14.0% year over year
Sales Activity Intensity
Healthy · pending in the first 30 days
Median sale price
+1.1% year over year
New listings
−4.4% year over year
Pending sales
−19.9% year over year
Closed sales
−25.1% year over year
Average market time
−3.1% year over year
Resale supply
JLS November 1 snapshot
Sales Activity Intensity by price range
Share of resale listings receiving an accepted offer within their first 30 days.
Selective: slower early activity · Healthy: steady early activity · Strong: stronger early activity · Very Strong: fastest early activity among the bands shown
Previous video: October Seattle update
Jason’s October video discusses September activity and planning a move around cash, equity and the full cost of the next home.
Got equity? Run the numbers.
Previous October edition. Use the updated tables below for October activity.
Watch on YouTubeMore choice, with different supply readings
The takeaway: Condos have more reported supply than houses and townhomes. Compare like with like.
InfoSparks reports 4.9 months of all-property supply, 3.6 months for Residential, 6.9 months for condos and 5.4 months for new construction based on pending sales. Residential Resale, explicitly filtered to Residential plus Previously Owned, is 3.3 months.
InfoSparks divides month-end active inventory by the average monthly pending sales over the preceding 12 months. Its closing-based supply uses the equivalent trailing 12-month closing average.
John L. Scott’s separate resale table reports 4.5 months: 2,492 November 1 active listings divided by 549 October pending sales, rounded.
For a move-up seller, look at both transactions together. What could your current home sell for, what can you buy, what cash remains after closing, and what happens if one side takes longer? A slower sale can come with more negotiating room on the purchase. Run the full move rather than looking at one asking price.
Inventory and offers eased. More sales finished.
The takeaway: Compared with September in the same current pull, inventory fell 5.3%, pending sales fell 6.5% and closings rose 13.4%.
October brought 1,297 new listings, down 4.4% from a year earlier. Seattle ended the month with 3,487 active listings, up 14.0% year over year but below September’s revised 3,682. Pending sales totaled 636, down 19.9% year over year and below September’s revised 680.
Completed sales reached 652, up from 575 in September, but down 25.1% from October 2025. Closings reflect transactions negotiated earlier; an increase in closings does not mean current buyer demand accelerated.
The all-type median rose from September’s revised $830,000 to $895,000, a 7.8% monthly increase and a 1.1% increase from last October. The average was $1,073,472, down 1.3% year over year. Median and average describe the homes that sold.
Average market time was 31 days, compared with 36 in September and 32 last October. Showings averaged 3.0 per active listing, down 18.9% year over year; average showings to pending were 11, down 8.3%.
Sales averaged 98.9% of final list price and 97.1% of original list price. A home selling close to its final asking price may already have taken a price reduction.
What the terms mean
Inventory is the active choice at month end. Pending means an offer was accepted. Closed means the sale finished. They describe different stages of a transaction.
Median is the middle sale price. Average adds prices and divides by the included sales count, so expensive sales can pull it higher. Days on market measures listing to accepted offer in the source definition, rather than the entire closing timeline.
Months of supply expresses inventory against a measured sales pace.
Houses, townhomes and condos: compare the right group
The takeaway: A citywide median can hide a very different experience in your price range or property type.
| Segment | Median price | Average price | Active | Pending | Closed | Average days | Supply: contracts | Sale ÷ final list | Sale ÷ original list |
|---|---|---|---|---|---|---|---|---|---|
| Residential | $950,000 (-5.0%) | $1,198,366 (+1.6%) | 1,853 (+16.4%) | 464 (-15.9%) | 500 (-19.5%) | 25 | 3.6 | 99.5% | 97.9% |
| Condominium | $515,000 (-12.6%) | $599,400 (-13.3%) | 1,248 (+9.9%) | 150 (-29.2%) | 133 (-36.4%) | 49 | 6.9 | 97.5% | 95.1% |
| New construction | $885,000 (+6.0%) | $986,641 (-4.8%) | 682 (+0.4%) | 96 (-25.0%) | 73 (-45.1%) | 38 | 5.4 | 98.6% | 96.9% |
| Residential Resale | $970,000 (-6.0%) | $1,215,088 (+1.3%) | 1,396 (+23.2%) | 393 (-15.3%) | 449 (-14.8%) | 24 | 3.3 | 99.5% | 98.0% |
Residential: The median was $950,000, down 5.0% from last October, while the average increased 1.6%. There were 500 closings and 464 pending sales. Houses and townhomes have less reported supply than condos, but still more inventory than last year. Preparation and a defensible price matter.
Condominiums: The median was $515,000, down 12.6%; the average fell 13.3%. Inventory reached 1,248, with 150 accepted offers and 133 closings. At 6.9 months of contract-based supply and 49 average days to an offer, condo buyers generally have more room to compare. Read the resale certificate, reserves, insurance, assessments, rental rules and lender requirements before treating a lower price as a bargain.
New construction: Inventory was 682, up only 0.4% year over year, while pendings fell 25.0% and closings fell 45.1%. The $885,000 median increased 6.0% even as the average fell 4.8%. That contrast is a reminder that the sales mix matters. A builder incentive should be compared with price, loan fees, finish quality and timing.
Residential Resale: This month’s column is specifically Residential plus Previously Owned, with 449 closings, a $970,000 median and 3.3 months of reported supply.
Your price range changes the negotiating picture
The takeaway: JLS’s lowest resale supply is in the $1 million–$1.5 million band. Its lower price bands and $2 million-plus range offer more selection.
The JLS table reports 3.0 months between $1 million and $1.5 million, 3.4 between $1.5 million and $2 million, and 3.7 between $750,000 and $1 million. Below $750,000, reported supply ranges from 5.2 to 7.4 months. Above $2 million it is 6.7 months.
| Seattle resale price | October new | October pending | Active November 1 | Supply months | First 30 days* | Intensity* |
|---|---|---|---|---|---|---|
| Under $350K | 82 | 40 | 294 | 7.4 | 18.1% | Selective |
| $350K–$500K | 113 | 61 | 339 | 5.6 | 21.6% | Selective |
| $500K–$750K | 265 | 129 | 676 | 5.2 | 23.9% | Selective |
| $750K–$1M | 269 | 141 | 524 | 3.7 | 37.1% | Strong |
| $1M–$1.5M | 187 | 111 | 328 | 3.0 | 41.2% | Strong |
| $1.5M–$2M | 51 | 36 | 122 | 3.4 | 45.5% | Very Strong |
| $2M+ | 64 | 31 | 209 | 6.7 | 30.1% | Healthy |
| Total resale | 1,031 | 549 | 2,492 | 4.5 | 32.0% | Healthy |
October 2026 Seattle housing statistics
| Seattle metric | All properties | Residential | Condominium | New construction | Residential Resale |
|---|---|---|---|---|---|
| Average sales price | $1,073,472 (-1.3%) | $1,198,366 (+1.6%) | $599,400 (-13.3%) | $986,641 (-4.8%) | $1,215,088 (+1.3%) |
| Median sales price | $895,000 (+1.1%) | $950,000 (-5.0%) | $515,000 (-12.6%) | $885,000 (+6.0%) | $970,000 (-6.0%) |
| New listings | 1,297 (-4.4%) | 851 (-1.5%) | 380 (-8.7%) | 289 (-5.2%) | 656 (+0.2%) |
| Homes for sale | 3,487 (+14.0%) | 1,853 (+16.4%) | 1,248 (+9.9%) | 682 (+0.4%) | 1,396 (+23.2%) |
| Pending sales | 636 (-19.9%) | 464 (-15.9%) | 150 (-29.2%) | 96 (-25.0%) | 393 (-15.3%) |
| Closed sales | 652 (-25.1%) | 500 (-19.5%) | 133 (-36.4%) | 73 (-45.1%) | 449 (-14.8%) |
| Average days on market | 31 (-3.1%) | 25 (-3.8%) | 49 (+6.5%) | 38 (+15.2%) | 24 (0.0%) |
| Months supply: contracts | 4.9 (+28.9%) | 3.6 (+28.6%) | 6.9 (+30.2%) | 5.4 (+20.0%) | 3.3 (+32.0%) |
| Months supply: closings | 4.9 (+28.9%) | 3.6 (+28.6%) | 6.8 (+28.3%) | 5.3 (+15.2%) | 3.3 (+32.0%) |
| Average sale/final list | 98.9% (-0.5%) | 99.5% (-0.5%) | 97.5% (-0.8%) | 98.6% (-0.9%) | 99.5% (-0.6%) |
| Average sale/original list | 97.1% (-1.0%) | 97.9% (-0.8%) | 95.1% (-1.6%) | 96.9% (-1.9%) | 98.0% (-0.8%) |
| Average price per sq ft | $544 (-4.6%) | $548 (-2.5%) | $551 (-10.1%) | $610 (-7.7%) | $543 (-1.5%) |
| Dollar volume | $698,830,191 (-26.2%) | $597,984,446 (-18.4%) | $80,319,545 (-44.4%) | $72,024,782 (-47.8%) | $545,574,661 (-13.7%) |
| Average shows to pending | 11 (-8.3%) | 12 (-7.7%) | 9 (0.0%) | 6 (-45.5%) | 13 (0.0%) |
| Showings per listing | 3.0 (-18.9%) | 3.7 (-24.5%) | 1.9 (-17.4%) | 1.8 (-25.0%) | 4.2 (-25.0%) |
What I would do as a Seattle buyer or seller
The market gives us options, but it also asks us to be honest about the home, the money and the timing. Here is where I would focus.
For buyers
- Use the selection to revisit a home, inspect carefully and compare alternatives.
- Negotiate the complete deal: price, repairs, lender-approved closing-cost assistance and timing.
- Stay ready when a home is well priced and well presented. Extra inventory does not eliminate competition for every property.
- Compare the full payment and keep reserves for maintenance, repairs and life changes.
For sellers
- Start with your price peer group. What can the buyer choose instead, and why would they choose yours?
- Get the three Ps right: price, presentation and promotion.
- Pay attention to showings, second visits and feedback. If buyers keep choosing the alternatives, respond.
- If selling needs to happen, build the plan around today’s conditions rather than a promised spring rebound.
In some of my current pricing conversations, I’m allowing for an adjustment around 5% below what older comparables initially suggest. I make that call by comparing the home’s condition, location and current competition. If your home is the strongest choice at its price, that price may be justified. The peer group is the test.
I’m also seeing developers continue to look for opportunities, so some fixer-uppers are finding buyers. The right preparation plan depends on who is likely to buy the property; spending heavily on finishes may not make sense for a redevelopment candidate.
How October compares with the previous five years
The takeaway: Inventory is higher and closings lower than in each of the previous five Octobers shown here.
The comparison is seasonally matched: October against October. It includes the unusual pandemic-era market and changes in the mix of homes sold.
| Seattle metric | Oct 2021 | Oct 2022 | Oct 2023 | Oct 2024 | Oct 2025 | Sep 2026 | Oct 2026 | vs. September |
|---|---|---|---|---|---|---|---|---|
| Homes for sale | 1,388 | 1,924 | 1,923 | 2,510 | 3,058 | 3,682 | 3,487 | -5.3% |
| Pending sales | 1,173 | 660 | 645 | 849 | 794 | 680 | 636 | -6.5% |
| Closed sales | 1,220 | 722 | 707 | 922 | 871 | 575 | 652 | +13.4% |
| Average sales price | $954,961 | $977,057 | $923,041 | $1,014,447 | $1,087,607 | $990,766 | $1,073,472 | +8.3% |
| Median all-type price | $780,000 | $836,500 | $790,000 | $862,501 | $885,000 | $830,000 | $895,000 | +7.8% |
| Median Residential | $835,000 | $910,000 | $878,000 | $952,500 | $1,000,000 | $920,000 | $950,000 | +3.3% |
| Median Condominium | $500,000 | $515,000 | $570,000 | $585,000 | $589,000 | $520,000 | $515,000 | -1.0% |
| Average days on market | 19 | 24 | 28 | 31 | 32 | 36 | 31 | -13.9% |
| Months supply: contracts | 1.2 | 2.1 | 2.7 | 3.3 | 3.8 | 5.1 | 4.9 | -3.9% |
Neighborhoods
Seattle is a collection of smaller markets. Your neighborhood, price range, home style, condition and the season all influence competition and negotiating room. Citywide numbers give us the big picture; comparing homes like yours tells us how to price, prepare or make an offer.
The takeaway: West Seattle’s average time to an offer was shorter than the city’s Residential average. Ballard/Greenlake matched it.
| NWMLS Residential area | Median (vs. last year) | Active (vs. last year) | Pending (vs. last year) | Closed / sample count | Average days | Supply: contracts | Sale ÷ original list |
|---|---|---|---|---|---|---|---|
| Seattle Residential | $950,000 (-5.0%) | 1,853 (+16.4%) | 464 (-15.9%) | 500 (-19.5%) | 25 | 3.6 | 97.9% |
| MLS 705 Ballard/Greenlake | $990,000 (-5.2%) | 479 (+21.3%) | 125 (-17.8%) | 145 (-14.7%) | 25 | 3.3 | 98.8% |
| MLS 140 West Seattle | $820,000 (-8.8%) | 263 (+15.9%) | 75 (-27.2%) | 81 (-29.6%) | 21 | 2.9 | 98.1% |
MLS 705 Ballard/Greenlake: The $990,000 median comes from 145 October closings. Its average price was $1,095,122. Inventory increased 21.3% and pending sales fell 17.8% from last October. Average market time was 25 days, up 13.6%. At 100.4% of final list price but 98.8% of original list price, the averages also show why the first and final asking prices deserve separate attention.
MLS 140 West Seattle: The median was $820,000 across 81 closings, down 8.8% year over year; the average was $881,125, down 14.8%. Average market time was 21 days and reported supply 2.9 months. Buyers still have more active choices than last year, but the right home can require a quicker decision than the citywide condo figures might suggest.
A price reduction and a seller credit solve different problems
A lower price reduces the amount you pay for the property. With the same down-payment percentage, it also reduces the loan and cash down. A lender-approved seller credit can help with eligible closing costs or financing expenses. One may help your cash position more; the other may improve the ongoing payment. Ask your lender to put both options side by side.
Example: a $10,000 price reduction versus a $10,000 seller credit
Imagine a $900,000 home and a buyer making a 20% down payment. These are fictional offer scenarios, not local market statistics or loan quotes.
| Offer scenario | Purchase price | 20% down | Loan amount | Seller credit |
|---|---|---|---|---|
| Lower price | $890,000 | $178,000 | $712,000 | $0 |
| Original price with credit | $900,000 | $180,000 | $720,000 | Up to $10,000 toward lender-approved costs |
The lower price reduces the down payment by $2,000 and the loan by $8,000. The credit keeps the larger loan and down payment but may reduce eligible costs paid at closing. It is not cash back or a substitute for the required down payment. Your lender must confirm the permitted credit, actual eligible costs, rate and payment. Ask for both options on paper so you can compare cash needed now, monthly payment and reserves left afterward.
Our October city data shows an average sale at 97.1% of original list price. Repairs, loan costs and timing can change the practical value of a transaction without showing up as a lower recorded sale price.
For dated regional background, Redfin’s study of its agents’ transactions during the three months ending August 31, 2026 reported concessions in 48.5% of Seattle-area sales, down 21.4 percentage points from the equivalent prior-year period.
Compare any builder incentive with the total purchase price, loan fees, finishes and move-in date. A large credit does not automatically make a home the best deal. A temporary buydown also does not permanently change the underlying note rate. Understand the payment after the assistance expires.
Mortgage rates: use dated benchmarks and your own quote
The takeaway: The daily MND benchmark was 7.25% on November 4. The latest verified Freddie Mac weekly average was 7.24% on October 29.
November 4, 2026.
The supplied JLS graphic’s 7.27% reading is dated November 2 and matches the MND historical table. MND then reported 7.30% on November 3 and 7.25% on November 4, a 0.05 percentage-point daily decline.
MND’s index uses a top-tier conventional, conforming 30-year fixed scenario, with a baseline around 75% loan-to-value and 780 credit score, adjusted for upfront points.
Freddie Mac’s weekly 30-year average declined from 7.32% on October 22 to 7.24% on October 29, a 0.08 percentage-point change. Its 15-year average was 6.60% on October 29.
Have your lender compare the loan you qualify for with a lower price, seller assistance and any available buydown. Include fees, not just the rate. A permanent buydown uses upfront points to reduce the rate on that loan. A temporary buydown reduces your payment contribution for a limited period; check the full later payment.
A future refinance may help if rates, costs and qualifications cooperate, but the purchase should work without it. Our 2022 vs. 2026 homebuyer comparison puts rate tradeoffs beside selection and negotiating opportunities.
What the payment looks like at Seattle’s median price
The takeaway: On this example loan, a quarter-point rate change is about $121–$122 per month in principal and interest.
At October’s all-type median price of $895,000, a 20% down payment is $179,000 and the loan is $716,000. The examples below hold that price and down payment constant. The table compares payments at 7.00%, 7.25% and 7.50%.
| 30-year fixed rate scenario | Monthly principal & interest |
|---|---|
| 7.00% | $4,764 |
| 7.25% | $4,884 |
| 7.50% | $5,006 |
Residential’s $950,000 median and the $515,000 condo median also represent different ownership costs. A lower condo purchase price may come with substantial dues or future assessments. Compare actual homes and all the costs that come with them.
Check three parts of the cost.
The mortgage is one piece. Leave room for your life.
Cash you need now
Add down payment and closing costs. Then check the savings left for repairs and emergencies.
The loan you are choosing
Compare rate and fees. If a payment is temporarily lower, ask when it changes and what follows.
The monthly cost of living there
Add taxes, insurance, dues, utilities and maintenance. Compare the total with your budget.
Should you rent or buy in Seattle right now?
Buying is not automatically better than renting. The right answer depends on how long you expect to stay, cash reserves, monthly cost, flexibility and what you want your housing to do for your life.
Renting can fit better when a move is likely soon, your location or job is uncertain, comparable rent is much lower than ownership costs, or a purchase would drain your reserves. Ownership adds maintenance, transaction costs and uncertainty about short-term resale value.
Buying may fit when the home supports a longer-term plan, the all-in payment is manageable and you still have reserves after closing. Stability, control over the property and paying down principal can have value.
Renting may fit better when
- You need flexibility or expect to move soon.
- A purchase would stretch the monthly budget.
- You are still learning the neighborhood or property type.
- You need more time to build cash reserves.
Buying may fit better when
- You expect to stay long enough to absorb transaction costs.
- The payment works without a future refinance.
- You retain savings for repairs and life changes.
- The home fits even if prices are flat or soften for a while.
Use today’s selection to compare actual alternatives. What would a suitable rental cost, what would the full ownership cost be, and what does either choice let you do with the rest of your money? The useful answer comes from your numbers and likely timeline.
Seattle’s winter selling season: refresh the plan
Fewer new listings. More reasons to stand out.
John L. Scott’s November commentary describes a winter cleanup as buyers absorb some inventory and some sellers withdraw to reposition later.
Seattle’s October inventory declined from September. Buyers should compare the choices available now. Sellers should reassess price, access, presentation, photos and feedback rather than relying on spring to solve the problem.
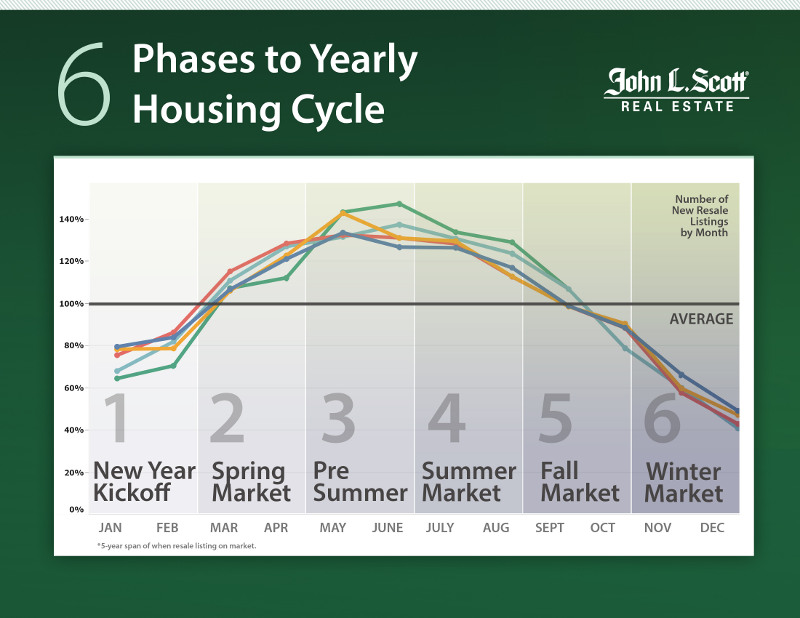
If you are selling and buying, plan the whole move. A change in the sale price can be accompanied by a different negotiating opportunity on the next purchase. Timing, financing and a backup plan deserve the same attention as the listing price.
Will the home still fit your life in a few years?
Jobs, household growth and population help shape long-term demand.
Start with the neighborhood, commute, schools or services you use, the layout and the payment. Then ask what happens if your job, household or plans change. A home that works across several plausible life scenarios is a stronger starting point than a purchase built around a short-term price prediction.
Older growth stories and seasonal charts belong in background context. Your current peer group, financing and likely ownership horizon are the more immediate tools for a decision today.
What does your money buy in Seattle right now?
Here is where the report becomes a home search. Browse Seattle listings and compare the choices in your price group. Look beyond the asking price: condition, dues, repairs, financing and the full payment all affect the deal.
Seattle housing market summary
The November edition covers October activity: 3,487 homes for sale, 636 pending sales, 652 closings and a $895,000 all-type median price. Buyers have more selection than last October, while both pending and completed sales are below last year. Inventory and pending sales eased from September in the current pull, while closings increased.
Residential, condo and new-construction markets deserve separate conversations. Reported contract-based supply is 3.6, 6.9 and 5.4 months respectively. JLS’s separate resale snapshot is 4.5 months using a different method.
For sellers, compare the homes buyers can choose at your price and get the three Ps right. For buyers, use the negotiating room without making the purchase depend on future appreciation or a refinance. You do not need a perfect market to make a thoughtful move. You need a home, a payment and a plan that fit.
Seattle housing market FAQ
Is Seattle a buyer’s market in November 2026?
Buyers generally have more choice than a year ago, but conditions vary. October InfoSparks contract-based supply is 3.6 months for Residential and 6.9 for condos.
Why does JLS show 4.5 months and InfoSparks show 4.9?
JLS divides its November 1 resale inventory by October pending sales. InfoSparks uses month-end inventory divided by a trailing 12-month average monthly pending count. The property groups and snapshots also differ.
What is Seattle’s median sale price?
The October 2026 all-property Seattle-city median is $895,000. Residential is $950,000 and Condominium is $515,000.
Which segment offers the most selection?
Among the displayed broad categories, Condominium has the most contract-based supply at 6.9 months, followed by new construction at 5.4 and Residential at 3.6.
Did Seattle sales improve in October?
Closings increased from 575 in September to 652 in October in the current pull, but October closings were 25.1% below last year. Pending sales fell from 680 to 636 and were 19.9% below last October.
Are sale-price ratios the same as seller concessions?
No. InfoSparks price and list-price ratios do not deduct seller concessions. A seller credit for eligible costs or repairs is different from lowering the purchase price.
What is happening with new construction?
October new-construction active inventory was 682, up 0.4% year over year. Pending sales were 96, down 25.0%, and closings were 73, down 45.1%. Contract-based supply was 5.4 months.
What does Sales Activity Intensity measure?
The JLS indicator measures the share of listings that receive an accepted offer within their first 30 days.
How should Seattle sellers approach pricing?
Compare your home with the choices buyers have at your price. Use current competition and recent sales, then account for condition, location, concessions and timing. Give buyers a clear reason to choose your home.
What does the mortgage-payment example cover?
Monthly principal and interest on a fixed 30-year $716,000 loan, with 20% down on a $895,000 home. At 7.25%, that is about $4,884 per month.
What does this market mean for your move?
Citywide numbers are the starting point. Let’s compare your home, price range, neighborhood, timing and payment with the choices available now.
What’s My Home Worth?Talk With The Madrona Group